Flexible Packaging Market

Flexible Packaging Market by Packaging Type (Pouches, Bags, Roll Stock, Films & Wraps), Printing Technology (Flexography, Rotogravure, Digital Printing), End-user Industry, Material (Paper, Plastic, Metal) and Region - Global Forecast to 2027

Report Code: PK 8505 Nov, 2022, by marketsandmarkets.com

Flexible Packaging Market

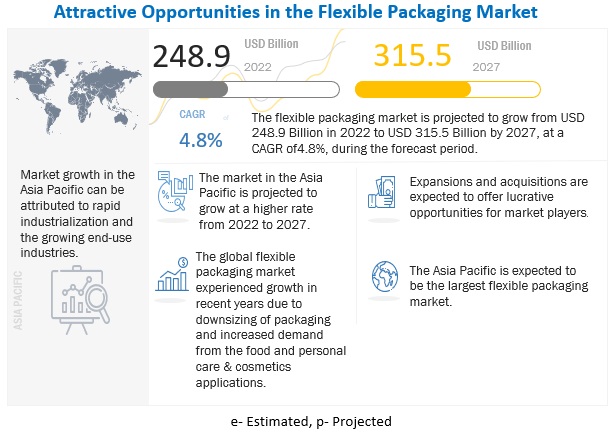
The global flexible packaging market size was valued at USD 248.9 billion in 2022 and is projected to reach USD 315.5 billion by 2027, growing at 4.8% cagr during the forecast period. Flexible packaging is a method of packaging goods in a more affordable and adaptable way by using materials that aren't rigid in nature. It is a relatively new technique in the packaging industry, but it has gained popularity because of its great effectiveness and low cost. A wide variety of flexible packaging products, such as pouches, bags, sachets, roll stocks, wraps, and others, are produced from a variety of flexible raw materials such as metal, plastic, and paper. Industries that require versatile packaging, like the food and beverage, personal care, and pharmaceutical sectors, can benefit greatly from flexible packaging.
Flexible Packaging Market

To know about the assumptions considered for the study, Request for Free Sample Report

Flexible Packaging Market Dynamics

Driver: The rising demand for flexible packaging in the food and beverage sector drives the market.

The population of the twenty-first century has a strong preference for packaging that is both practical and cost-effective. People are choosing to eat prepared meals that are served in flexible packaging and pouches due to growing urbanization, busy work schedules, and the need to arrive on time. As a result of this, more food businesses are thinking about using flexible packaging for their goods. Packaging industry leaders are doing this by engaging in strategic activities like mergers and acquisitions, product developments, investments, and facility expansions that help them in advancing their goal of providing adequate solutions for their consumers in a cost-effective way.

Restraint: High cost of flexible packaging raw material and unavailability of good recycling infrastructure

The prices of raw materials such as plastic, paper, and metals, which are used for producing various flexible packaging products, are nowadays on the higher side. Additionally, due to a lack of supply, the cost of polypropylene, which is used in resins, bottles, and packaging films, has increased. The competitiveness of businesses in the flexible packaging sector has been impacted by this circumstance.

There is a non-availability of a closed-loop system that is used to handle the recycling of flexible packaging products, especially those which are made from multi-layer high-barrier materials. However, recycling multi-layered flexible packaging products involves more steps as compared to traditional packaging. In addition to this, the recycling process of flexible packaging products is a time-consuming and energy-intensive process, which requires a good recycling infrastructure.

Read more: Flexible Plastic Packaging Market Report

Opportunities: Growing demand for sustainable packaging

Brands are now putting a lot of effort into finding ways to lower their carbon footprint due to increased concern about their environmental impact. The Paris Agreement, a binding agreement on climate change, was unveiled in 2015 to aid in limiting global warming to 2 degrees. With a commercial commitment to reducing their emissions, several nations have now made a commitment to this cause by setting net-zero targets. Currently, many manufacturers focus on providing sustainable packaging solutions to consumers by optimizing the packaging materials and using the right packaging materials to make things smaller and lighter, reducing the need for transportation.

Increasing awareness regarding hygiene is the major key factor that drives the market for flexible packaging.

Challenges: Rapid changes in the technology

Formats, designs, and trends in flexible packaging are always changing along with technological possibilities. The packaging industry has acknowledged the need for smart packaging to enable inventory management, sales tracking, product tracking, intelligent storage, and other functions with less manual labor. As a result of the rapid change in technology, the existing flexible products have become outdated now. In addition to this, many manufacturers want to attract more consumers by offering appealing or attractive packaging solutions that fuel the varying needs of consumers.

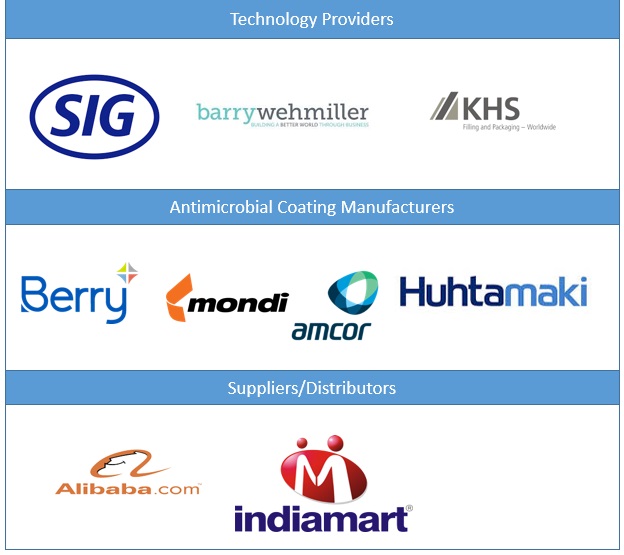
Flexible Packaging Market Ecosystem
Flexible Packaging Market Size, and Share

To know about the assumptions considered for the study, download the pdf brochure

By End Use Industry, the Food industry accounted for the highest CAGR during the forecast period

In the food industry, the increasing concern about hygiene and sustainability, rising urbanization, changing lifestyles, and high disposable income are the major factors that drive the market of flexible packaging. Customers want their food products to be both hygienic and safe, as well as appealing to the eye. Manufacturers have a very strong ecosystem for food service packaging. They are constantly inventing to ensure that the consumer benefits, and they have a specialized R&D house that conducts numerous research-based tests employing the most recent technologies. However, due to the other favorable properties of flexible packagings, such as excellent barrier properties, it can be made using fewer resources, increases the product shelf life, and many more, which attract consumers mainly from the food industry.

By Packaging Type, the Pouches segment accounted for the highest CAGR during the forecast period

Pouches are small bags comprising two side flat sheets that are flexible and sealed along the edges to form a compartment whose volume is dependent on the relative position of the walls. There are mainly two types of pouches: stand-up pouches (SUPs) and flat or pillow pouches. The two types of stand-up pouches are standard stand-up pouches and retort stand-up pouches.

Pouches are ideal for bulk coffee packaging and food items such as dried or smoked meats. They are easy to use, heat sealable, and available in convenient packaging with multiple sizes and formats.

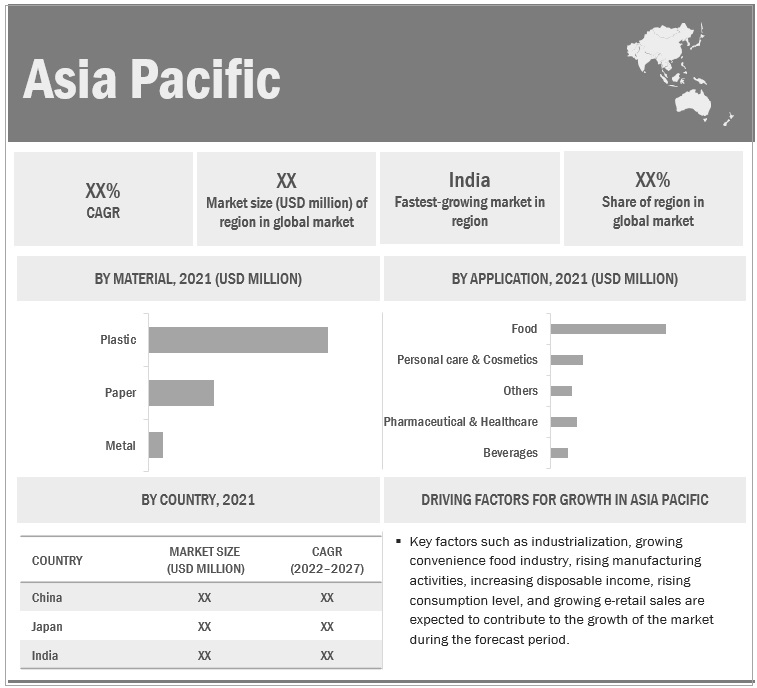
Asia Pacific is projected to account for the highest CAGR in the flexible packaging market during the forecast period

Asia Pacific region witnessed the fastest-growing flexible packaging market. The various countries which are covered in this region are India, China, Japan, Australia, South Korea, and the Rest of Asia Pacific. Countries such as India, China, and Japan are expected to post high growth in the flexible packaging market due to growing developmental activities and rapid economic expansion. Additionally, the increasing population in these countries presents a huge customer base for FMCG products and food & beverages, which, in turn, is expected to lead to the growth of the flexible packaging market.

By Material Type, the Paper segment accounted for the highest growth during the forecast period

The shift toward flexible packaging options made of paper is one of the major trends that is anticipated to have an impact on the flexible packaging business in the future. This is consistent with the rising popularity of environmentally friendly and sustainable packaging solutions. Paper-based packaging is more practical because it is both recyclable and biodegradable in nature. Hence, due to these properties, paper-made packaging products will have a great demand in the future as many manufacturers move towards sustainable packaging options.

By Printing Technology, the Flexography segment accounted for the second-highest CAGR during the forecast period

Brands that promote goods as diverse as food, wine, motor oil, and grass seed prefer flexographic printing over other printing techniques. Flexo now provides advantages that are highly appealing to both product marketing and purchasing management thanks to newfound capacities to produce top-quality images and graphics, deliver high consistency and repeatability from job to job, and enable quick, economical changeovers that support small-quantity runs. As some market segments grow and make use of flexographic printing's benefits, its popularity is anticipated to soar rapidly.
Flexible Packaging Market Size, and Share

Flexible Packaging Market Players

Flexible packaging companies comprises major manufacturers such as Huhtamaki Oyj (Finland), Berry Global Group Inc. (US), Amcor Limited. (Australia), Mondi Group.(UK), and Sonoco Products Company (US) were the leading players in the flexible packaging market. Expansions, acquisitions, joint ventures, and new product developments are some of the major strategies adopted by these key players to enhance their positions in the flexible packaging market.

Please visit 360Quadrants to see the vendor listing of Top 21 Flexible Packaging Companies, Worldwide 2023 

Flexible Packaging Market Report Scope

Report Metrics

Details

Market Size Value in 2022 USD 248.9 billion
Revenue Forecast in 2027 USD 315.5 billion
CAGR 4.8%
Years Considered 2020-2027
Base year 2021
Forecast period 2022-2027
Unit considered Value (USD Billion), and Volume (Kilo Ton)
Segments Packaging Type, Material, Printing Technology, End Use Industry, and Region
Regions North America, Europe, South America, APAC, Middle East, and Africa.
Companies The major players are Huhtamaki Oyj (Finland), Berry Global Group Inc. (US), Amcor Limited. (Australia), Mondi Group.(UK), Sonoco Products Company (US), Westrock Company (US), Constantia Flexibles (Austria), Sealed Air Corporation (US), Transcontinental Inc (Canada), DS Smith (UK), and others are covered in the flexible packaging market.

This research report categorizes the global flexible packaging market on the basis of Type, Application, and Region.

Flexible Packaging Market by Packaging Type
  • Pouches
  • Rollstock
  • Bags
  • Films & Wraps
  • Others
Flexible Packaging Market by Material
  • Plastic
  • Paper
  • Metal
Flexible Packaging Market by Printing Technology
  • Rotogravure
  • Flexography
  • Digital Printing
  • Others
Flexible Packaging Market by End Use Industry
  • Food
  • Beverages
  • Pharmaceutical & Healthcare
  • Personal Care & Cosmetics
  • Others
Flexible Packaging Market by Region
  • North America
  • Europe
  • Asia Pacific (APAC)
  • South America
  • Middle East
  • Africa

Recent Developments

  • In October 2022, For the relaunch of its premium Appetitt brand, Mondi Group worked with renowned Norwegian pet food company Felleskjøpet to transition to recyclable high-barrier packaging.
  • In September 2022, Huhtamaki Oyj invested in the sustainable packaging fund run by Emerald Technology Ventures AG, which focuses on cutting-edge sustainable packaging technologies.
  • In September 2022, Sonoco Products Company has acquired. S.P. Holding, Skjern A/S, a leading producer of high-grade paperboard from 100% recycled paper for rigid paper containers, tubes and cores, and other applications.
  • In September 2022, New research and development (R&D) facility is being built at Mondi Steinfeld in Germany with an estimated €5 million investment by Mondi Group.
  • In September 2022, Berry Global Group Inc. has announced a collaboration with Mars Inc., to launch its popular pantry-sized treats in polyethylene terephthalate (PET) jars that have been optimized by including 15% recycled plastic content, i.e., post-consumer resin (PCR).
  • In August 2022, Amcor Limited acquired DG Pack, which is currently known as Amcor Flexibles CZ • Prostejov, a world-class flexible packaging plant.
  • In August 2022, Amcor Limited opened an innovation center in China.
  • In May 2022, Amcor Limited expanded its product portfolio by adding High Shield laminates to the pharmaceutical packaging portfolio.
  • In May 2022, Berry Global Group Inc. has launched a refuse sack business in the name of Ruffies in the United Kingdom (UK).
  • In January 2022, Huhtamaki Oyj acquired full ownership of its Polish joint venture firm, Huhtamaki Smith Anderson sp. z o.o, from Smith Anderson Group Ltd.

Frequently Asked Questions (FAQ):

To speak to our analyst for a discussion on the above findings, click Speak to Analyst


TABLE OF CONTENTS
 
1 INTRODUCTION (Page No. - 37)
    1.1 STUDY OBJECTIVES 
    1.2 MARKET DEFINITION 
    1.3 INCLUSIONS AND EXCLUSIONS 
          TABLE 1 INCLUSIONS AND EXCLUSIONS
    1.4 MARKET SCOPE 
           1.4.1 FLEXIBLE PACKAGING MARKET SEGMENTATION
    1.5 YEARS CONSIDERED 
           1.5.1 REGIONS COVERED
    1.6 CURRENCY CONSIDERED 
    1.7 UNIT CONSIDERED 
    1.8 STAKEHOLDERS 
    1.9 LIMITATIONS 
 
2 RESEARCH METHODOLOGY (Page No. - 42)
    2.1 RESEARCH DATA 
          FIGURE 1 FLEXIBLE PACKAGING MARKET: RESEARCH DESIGN
           2.1.1 SECONDARY DATA
                    2.1.1.1 Key data from secondary sources
           2.1.2 PRIMARY DATA
                    2.1.2.1 Key data from primary sources
                    2.1.2.2 Key primary insights
                                FIGURE 2 LIST OF STAKEHOLDERS AND BREAKDOWN OF PRIMARY INTERVIEWS
    2.2 MARKET SIZE ESTIMATION 
          FIGURE 3 MARKET SIZE ESTIMATION: BOTTOM-UP APPROACH
          FIGURE 4 MARKET SIZE ESTIMATION: TOP-DOWN APPROACH
          FIGURE 5 MARKET SIZE ESTIMATION: SUPPLY SIDE
    2.3 DATA TRIANGULATION 
          FIGURE 6 FLEXIBLE PACKAGING MARKET: DATA TRIANGULATION
    2.4 RESEARCH ASSUMPTIONS 
    2.5 LIMITATIONS 
    2.6 GROWTH RATE ASSUMPTIONS/GROWTH FORECAST 
 
3 EXECUTIVE SUMMARY (Page No. - 50)
    FIGURE 7 POUCHES SEGMENT TO LEAD FLEXIBLE PACKAGING MARKET BY 2027
    FIGURE 8 FLEXOGRAPHY SEGMENT ESTIMATED TO DOMINATE MARKET IN 2022
    FIGURE 9 FOOD TO BE LARGEST SEGMENT IN FLEXIBLE PACKAGING MARKET DURING FORECAST PERIOD
    FIGURE 10 PLASTIC SEGMENT TO DOMINATE MARKET DURING FORECAST PERIOD
    FIGURE 11 ASIA PACIFIC ACCOUNTED FOR LARGEST SHARE OF FLEXIBLE PACKAGING MARKET IN 2021
 
4 PREMIUM INSIGHTS (Page No. - 54)
    4.1 ASIA PACIFIC MARKET TO GROW AT HIGHER RATE DUE TO RAPID INDUSTRIALIZATION AND GROWING END-USE INDUSTRIES 
          FIGURE 12 DOWNSIZING OF PACKAGING PROPELLING MARKET
    4.2 FLEXIBLE PACKAGING MARKET, BY MATERIAL TYPE 
          FIGURE 13 PAPER TO BE FASTEST-GROWING SEGMENT
    4.3 FLEXIBLE PACKAGING MARKET, BY REGION AND APPLICATION 
          FIGURE 14 FOOD SEGMENT AND ASIA PACIFIC LED FLEXIBLE PACKAGING MARKET IN 2021
 
5 MARKET OVERVIEW (Page No. - 56)
    5.1 INTRODUCTION 
    5.2 MARKET DYNAMICS 
          FIGURE 15 FLEXIBLE PACKAGING MARKET: DRIVERS, RESTRAINTS, OPPORTUNITIES, AND CHALLENGES
           5.2.1 DRIVERS
                    5.2.1.1 Cost-effectiveness and increased product shelf life
                    5.2.1.2 Rising demand from end-use industries and increasing e-commerce sales
                                FIGURE 16 ONLINE RETAIL SALES
                                FIGURE 17 MONTHLY GROWTH RATE OF RETAIL SALES OF CONSUMER GOODS IN CHINA
                    5.2.1.3 Rising concerns toward sustainability
                                TABLE 2 PACKAGE COMPARISON
           5.2.2 RESTRAINTS
                    5.2.2.1 Non-availability of efficient recycling infrastructure
                    5.2.2.2 Rising prices of raw materials
           5.2.3 OPPORTUNITIES
                    5.2.3.1 Growing demand for sustainable packaging
                    5.2.3.2 Better substitute for traditional packaging materials
           5.2.4 CHALLENGES
                    5.2.4.1 Rapid changes in technologies
 
6 INDUSTRY TRENDS (Page No. - 62)
    6.1 VALUE CHAIN ANALYSIS 
          FIGURE 18 FLEXIBLE PACKAGING MARKET: VALUE CHAIN ANALYSIS
           6.1.1 PROMINENT COMPANIES
           6.1.2 SMALL & MEDIUM-SIZED ENTERPRISES
    6.2 PORTER’S FIVE FORCES ANALYSIS 
          FIGURE 19 FLEXIBLE PACKAGING MARKET: PORTER’S FIVE FORCES ANALYSIS
          TABLE 3 FLEXIBLE PACKAGING MARKET: PORTER’S FIVE FORCES ANALYSIS
           6.2.1 THREAT OF SUBSTITUTES
           6.2.2 BARGAINING POWER OF BUYERS
           6.2.3 THREAT OF NEW ENTRANTS
           6.2.4 BARGAINING POWER OF SUPPLIERS
           6.2.5 INTENSITY OF COMPETITIVE RIVALRY
    6.3 PATENT ANALYSIS 
           6.3.1 METHODOLOGY
           6.3.2 DOCUMENT TYPE
                    FIGURE 20 DOCUMENT TYPE (2018–2022)
                    FIGURE 21 PUBLICATION TRENDS, 2018–2022
           6.3.3 INSIGHTS
                    FIGURE 22 JURISDICTION ANALYSIS (TILL 2022)
           6.3.4 TOP APPLICANTS
                    FIGURE 23 TOP APPLICANTS, BY NUMBER OF PATENTS (TILL 2022)
    6.4 PRICING ANALYSIS 
           6.4.1 CHANGES IN FLEXIBLE PACKAGING PRICING IN 2021
    6.5 TECHNOLOGY ANALYSIS 
           6.5.1 VARIOUS PRINTING METHODS FOR FLEXIBLE PRODUCTS
                    6.5.1.1 Rotogravure
                    6.5.1.2 Lithography
                    6.5.1.3 Flexography
                    6.5.1.4 Digital printing
           6.5.2 FORM FILL SEAL MACHINE FOR FLEXIBLE PACKAGING
           6.5.3 STRETCHABLE PAPER FOR NOVEL PAPER APPLICATIONS
    6.6 TRADE ANALYSIS 
          TABLE 4 IMPORTING COUNTRIES FOR 48 PAPER AND PAPERBOARD; ARTICLES OF PAPER PULP, OF PAPER OR OF PAPERBOARD, 2021 (USD BILLION)
          TABLE 5 EXPORTING COUNTRIES FOR 48 PAPER AND PAPERBOARD; ARTICLES OF PAPER PULP, OF PAPER OR OF PAPERBOARD, 2021 (USD BILLION)
          TABLE 6 IMPORTING COUNTRIES FOR 3,920 PLASTICS, PLATES, SHEETS, FILMS, FOILS, STRIPS (NON-ADHESIVE), NON-CELLULAR, NOT REINFORCED, LAMINATED SUPPORTED, OR COMBINED WITH OTHER MATERIALS, 2021 (USD BILLION)
          TABLE 7 EXPORTING COUNTRIES FOR 3,920 PLASTICS, PLATES, SHEETS, FILMS, FOILS, STRIPS (NON-ADHESIVE), NON-CELLULAR, NOT REINFORCED, LAMINATED SUPPORTED, OR COMBINED WITH OTHER MATERIALS, 2021 (USD BILLION)
    6.7 MARKET MAPPING/ECOSYSTEM MAP 
          FIGURE 24 ECOSYSTEM MAP
    6.8 CASE STUDY ANALYSIS 
          TABLE 8 PAPERPAK CASE STUDY FOR KATHMANDU
          TABLE 9 PAPERPAK CASE STUDY FOR HARPER, INC.
    6.9 REGULATORY BODIES, GOVERNMENT AGENCIES, AND OTHER ORGANIZATIONS 
          TABLE 10 LIST OF REGULATORY BODIES, GOVERNMENT AGENCIES, AND OTHER ORGANIZATIONS
    6.10 KEY CONFERENCES AND EVENTS, 2022–2023 
           TABLE 11 FLEXIBLE PACKAGING MARKET: DETAILED LIST OF CONFERENCES AND EVENTS
 
7 FLEXIBLE PACKAGING MARKET, BY MATERIAL (Page No. - 78)
    7.1 INTRODUCTION 
          FIGURE 25 PLASTIC SEGMENT TO LEAD FLEXIBLE PACKAGING MARKET DURING FORECAST PERIOD
          TABLE 12 FLEXIBLE PACKAGING MARKET SIZE, BY MATERIAL, 2020–2027 (USD MILLION)
          TABLE 13 FLEXIBLE PACKAGING MARKET SIZE, BY MATERIAL, 2020–2027 (KILOTON)
    7.2 PLASTIC 
           7.2.1 MOST WIDELY USED MATERIAL IN FLEXIBLE PACKAGING
    7.3 PAPER 
           7.3.1 SUSTAINABILITY A KEY FACTOR
    7.4 METAL 
           7.4.1 EFFECTIVE BARRIER FOR MOISTURE
 
8 FLEXIBLE PACKAGING MARKET, BY PACKAGING TYPE (Page No. - 81)
    8.1 INTRODUCTION 
          FIGURE 26 POUCHES SEGMENT TO LEAD FLEXIBLE PACKAGING MARKET DURING FORECAST PERIOD
          TABLE 14 FLEXIBLE PACKAGING MARKET SIZE, BY PACKAGING TYPE, 2020–2027 (USD MILLION)
          TABLE 15 FLEXIBLE PACKAGING MARKET SIZE, BY PACKAGING TYPE, 2020–2027 (KILOTON)
    8.2 POUCHES 
           8.2.1 ECONOMICAL AND EFFICIENT PACKAGING
    8.3 ROLLSTOCK 
           8.3.1 DESIGNED TO INCREASE SHELF LIFE
    8.4 BAGS 
           8.4.1 PROVIDE ESTHETIC IMPACT AND MARKETING EXPOSURE
    8.5 FILMS & WRAPS 
           8.5.1 RISING DEMAND DUE TO INCREASING ONLINE SALES AND E-COMMERCE
    8.6 OTHERS 
           8.6.1 CONVENIENT, EASY TO HANDLE, AND ENVIRONMENT-FRIENDLY
 
9 FLEXIBLE PACKAGING MARKET, BY PRINTING TECHNOLOGY (Page No. - 86)
    9.1 INTRODUCTION 
          FIGURE 27 FLEXOGRAPHY SEGMENT TO LEAD FLEXIBLE PACKAGING MARKET DURING FORECAST PERIOD
          TABLE 16 FLEXIBLE PACKAGING MARKET SIZE, BY PRINTING TECHNOLOGY, 2020–2027 (USD MILLION)
          TABLE 17 FLEXIBLE PACKAGING MARKET SIZE, BY PRINTING TECHNOLOGY, 2020–2027 (KILOTON)
    9.2 FLEXOGRAPHY 
           9.2.1 SPEEDS UP PRINTING PROCESS
    9.3 ROTOGRAVURE 
           9.3.1 PROVIDES QUALITY IMAGES
    9.4 DIGITAL PRINTING 
           9.4.1 REDUCES ENVIRONMENTAL IMPACT
    9.5 OTHERS 
           9.5.1 LOWER INVESTMENT AND LESS FLOOR SPACE
 
10 FLEXIBLE PACKAGING MARKET, BY APPLICATION (Page No. - 90)
     10.1 INTRODUCTION 
             FIGURE 28 FOOD SEGMENT TO DOMINATE FLEXIBLE PAPER PACKAGING MARKET DURING FORECAST PERIOD
             TABLE 18 FLEXIBLE PACKAGING MARKET SIZE, BY APPLICATION, 2020–2027 (USD MILLION)
             TABLE 19 FLEXIBLE PACKAGING MARKET SIZE, BY APPLICATION, 2020–2027 (KILOTON)
     10.2 FOOD 
             10.2.1 RISING UTILIZATION OF CONVENIENCE FOODS TO BOOST MARKET
     10.3 BEVERAGES 
             10.3.1 SHIFT IN CONSUMER PREFERENCE TO BOOST MARKET
     10.4 PHARMACEUTICAL & HEALTHCARE 
             10.4.1 RISE IN DEMAND FOR PHARMACEUTICAL PRODUCTS TO BOOST MARKET
     10.5 PERSONAL CARE & COSMETICS 
             10.5.1 AFFORDABLE SMALL SIZE PACKAGING TO BOOST MARKET
     10.6 OTHERS 
 
11 FLEXIBLE PACKAGING MARKET, BY REGION (Page No. - 94)
     11.1 INTRODUCTION 
             FIGURE 29 ASIA PACIFIC TO BE FASTEST-GROWING MARKET FROM 2022 TO 2027
             TABLE 20 GLOBAL: FLEXIBLE PACKAGING MARKET SIZE, BY REGION, 2020–2027 (USD MILLION)
             TABLE 21 GLOBAL: MARKET SIZE, BY REGION, 2020–2027 (KILOTON)
             TABLE 22 GLOBAL: MARKET SIZE, BY PACKAGING TYPE, 2020–2027 (USD MILLION)
             TABLE 23 GLOBAL: MARKET SIZE, BY PACKAGING TYPE, 2020–2027 (KILOTON)
             TABLE 24 GLOBAL: MARKET SIZE, BY MATERIAL, 2020–2027 (USD MILLION)
             TABLE 25 GLOBAL: MARKET SIZE, BY MATERIAL, 2020–2027 (KILOTON)
             TABLE 26 GLOBAL: MARKET SIZE, BY APPLICATION, 2020–2027 (USD MILLION)
             TABLE 27 GLOBAL: MARKET SIZE, BY APPLICATION, 2020–2027 (KILOTON)
             TABLE 28 GLOBAL: MARKET SIZE, BY PRINTING TECHNOLOGY, 2020–2027 (USD MILLION)
             TABLE 29 GLOBAL: MARKET SIZE, BY PRINTING TECHNOLOGY, 2020–2027 (KILOTON)
     11.2 ASIA PACIFIC 
             FIGURE 30 ASIA PACIFIC: FLEXIBLE PACKAGING MARKET SNAPSHOT
             TABLE 30 ASIA PACIFIC: MARKET SIZE, BY COUNTRY, 2020–2027 (USD MILLION)
             TABLE 31 ASIA PACIFIC: MARKET SIZE, BY COUNTRY, 2020–2027 (KILOTON)
             TABLE 32 ASIA PACIFIC: MARKET SIZE, BY PACKAGING TYPE, 2020–2027 (USD MILLION)
             TABLE 33 ASIA PACIFIC: MARKET SIZE, BY PACKAGING TYPE, 2020–2027 (KILOTON)
             TABLE 34 ASIA PACIFIC: MARKET SIZE, BY MATERIAL, 2020–2027 (USD MILLION)
             TABLE 35 ASIA PACIFIC: MARKET SIZE, BY MATERIAL, 2020–2027 (KILOTON)
             TABLE 36 ASIA PACIFIC: MARKET SIZE, BY APPLICATION, 2020–2027 (USD MILLION)
             TABLE 37 ASIA PACIFIC: MARKET SIZE, BY APPLICATION, 2020–2027 (KILOTON)
             TABLE 38 ASIA PACIFIC: MARKET SIZE, BY PRINTING TECHNOLOGY, 2020–2027 (USD MILLION)
             TABLE 39 ASIA PACIFIC: MARKET SIZE, BY PRINTING TECHNOLOGY, 2020–2027 (KILOTON)
             11.2.1 CHINA
                        11.2.1.1 Increasing demand for consumer goods to drive market
                                      TABLE 40 CHINA: FLEXIBLE PACKAGING MARKET SIZE, BY PACKAGING TYPE, 2020–2027 (USD MILLION)
                                      TABLE 41 CHINA: MARKET SIZE, BY PACKAGING TYPE, 2020–2027 (KILOTON)
                                      TABLE 42 CHINA: MARKET SIZE, BY MATERIAL, 2020–2027 (USD MILLION)
                                      TABLE 43 CHINA: MARKET SIZE, BY MATERIAL, 2020–2027 (KILOTON)
                                      TABLE 44 CHINA: MARKET SIZE, BY APPLICATION, 2020–2027 (USD MILLION)
                                      TABLE 45 CHINA: MARKET SIZE, BY APPLICATION, 2020–2027 (KILOTON)
             11.2.2 JAPAN
                        11.2.2.1 Increasing disposable income and rising urbanization to drive market
                                      TABLE 46 JAPAN: FLEXIBLE PACKAGING MARKET SIZE, BY PACKAGING TYPE, 2020–2027 (USD MILLION)
                                      TABLE 47 JAPAN: MARKET SIZE, BY PACKAGING TYPE, 2020–2027 (KILOTON)
                                      TABLE 48 JAPAN: MARKET SIZE, BY MATERIAL, 2020–2027 (USD MILLION)
                                      TABLE 49 JAPAN: MARKET SIZE, BY MATERIAL, 2020–2027 (KILOTON)
                                      TABLE 50 JAPAN: MARKET SIZE, BY APPLICATION, 2020–2027 (USD MILLION)
                                      TABLE 51 JAPAN: MARKET SIZE, BY APPLICATION, 2020–2027 (KILOTON)
             11.2.3 INDIA
                        11.2.3.1 High demand from organized retail and e-commerce sectors
                                      TABLE 52 INDIA: FLEXIBLE PACKAGING MARKET SIZE, BY PACKAGING TYPE, 2020–2027 (USD MILLION)
                                      TABLE 53 INDIA: MARKET SIZE, BY PACKAGING TYPE, 2020–2027 (KILOTON)
                                      TABLE 54 INDIA: MARKET SIZE, BY MATERIAL, 2020–2027 (USD MILLION)
                                      TABLE 55 INDIA: MARKET SIZE, BY MATERIAL, 2020–2027 (KILOTON)
                                      TABLE 56 INDIA: MARKET SIZE, BY APPLICATION, 2020–2027 (USD MILLION)
                                      TABLE 57 INDIA: MARKET SIZE, BY APPLICATION, 2020–2027 (KILOTON)
             11.2.4 SOUTH KOREA
                        11.2.4.1 Rising demand for ready-to-eat and processed food
                                      TABLE 58 SOUTH KOREA: FLEXIBLE PACKAGING MARKET SIZE, BY PACKAGING TYPE, 2020–2027 (USD MILLION)
                                      TABLE 59 SOUTH KOREA: MARKET SIZE, BY PACKAGING TYPE, 2020–2027 (KILOTON)
                                      TABLE 60 SOUTH KOREA: MARKET SIZE, BY MATERIAL, 2020–2027 (USD MILLION)
                                      TABLE 61 SOUTH KOREA: MARKET SIZE, BY MATERIAL, 2020–2027 (KILOTON)
                                      TABLE 62 SOUTH KOREA: MARKET SIZE, BY APPLICATION, 2020–2027 (USD MILLION)
                                      TABLE 63 SOUTH KOREA: MARKET SIZE, BY APPLICATION, 2020–2027 (KILOTON)
             11.2.5 REST OF ASIA PACIFIC
                        TABLE 64 REST OF ASIA PACIFIC: FLEXIBLE PACKAGING MARKET SIZE, BY PACKAGING TYPE, 2020–2027 (USD MILLION)
                        TABLE 65 REST OF ASIA PACIFIC: MARKET SIZE, BY PACKAGING TYPE, 2020–2027 (KILOTON)
                        TABLE 66 REST OF ASIA PACIFIC: MARKET SIZE, BY MATERIAL, 2020–2027 (USD MILLION)
                        TABLE 67 REST OF ASIA PACIFIC: MARKET SIZE, BY MATERIAL, 2020–2027 (KILOTON)
                        TABLE 68 REST OF ASIA PACIFIC: MARKET SIZE, BY APPLICATION, 2020–2027 (USD MILLION)
                        TABLE 69 REST OF ASIA PACIFIC: MARKET SIZE, BY APPLICATION, 2020–2027 (KILOTON)
     11.3 NORTH AMERICA 
             TABLE 70 NORTH AMERICA: FLEXIBLE PACKAGING MARKET SIZE, BY COUNTRY, 2020–2027 (USD MILLION)
             TABLE 71 NORTH AMERICA: MARKET SIZE, BY COUNTRY, 2020–2027 (KILOTON)
             TABLE 72 NORTH AMERICA: MARKET SIZE, BY PACKAGING TYPE, 2020–2027 (USD MILLION)
             TABLE 73 NORTH AMERICA: MARKET SIZE, BY PACKAGING TYPE, 2020–2027 (KILOTON)
             TABLE 74 NORTH AMERICA: MARKET SIZE, BY MATERIAL, 2020–2027 (USD MILLION)
             TABLE 75 NORTH AMERICA: MARKET SIZE, BY MATERIAL, 2020–2027 (KILOTON)
             TABLE 76 NORTH AMERICA: MARKET SIZE, BY APPLICATION, 2020–2027 (USD MILLION)
             TABLE 77 NORTH AMERICA: MARKET SIZE, BY APPLICATION, 2020–2027 (KILOTON)
             TABLE 78 NORTH AMERICA: MARKET SIZE, BY PRINTING TECHNOLOGY, 2020–2027 (USD MILLION)
             TABLE 79 NORTH AMERICA: MARKET SIZE, BY PRINTING TECHNOLOGY, 2020–2027 (KILOTON)
             11.3.1 US
                        11.3.1.1 Leading market in North America
                                      TABLE 80 US: FLEXIBLE PACKAGING MARKET SIZE, BY PACKAGING TYPE, 2020–2027 (USD MILLION)
                                      TABLE 81 US: MARKET SIZE, BY PACKAGING TYPE, 2020–2027 (KILOTON)
                                      TABLE 82 US: MARKET SIZE, BY MATERIAL, 2020–2027 (USD MILLION)
                                      TABLE 83 US: MARKET SIZE, BY MATERIAL, 2020–2027 (KILOTON)
                                      TABLE 84 US: MARKET SIZE, BY APPLICATION, 2020–2027 (USD MILLION)
                                      TABLE 85 US: MARKET SIZE, BY APPLICATION, 2020–2027 (KILOTON)
             11.3.2 CANADA
                        11.3.2.1 Rising demand from food & beverage and home & personal care industries to drive market
                                      TABLE 86 CANADA: FLEXIBLE PACKAGING MARKET SIZE, BY PACKAGING TYPE, 2020–2027 (USD MILLION)
                                      TABLE 87 CANADA: MARKET SIZE, BY PACKAGING TYPE, 2020–2027 (KILOTON)
                                      TABLE 88 CANADA: MARKET SIZE, BY MATERIAL, 2020–2027 (USD MILLION)
                                      TABLE 89 CANADA: MARKET SIZE, BY MATERIAL, 2020–2027 (KILOTON)
                                      TABLE 90 CANADA: MARKET SIZE, BY APPLICATION, 2020–2027 (USD MILLION)
                                      TABLE 91 CANADA: MARKET SIZE, BY APPLICATION, 2020–2027 (KILOTON)
             11.3.3 MEXICO
                        11.3.3.1 Rising investments in consumer-packaged goods (CPGs) companies to boost market
                                      TABLE 92 MEXICO: FLEXIBLE PACKAGING MARKET SIZE, BY PACKAGING TYPE, 2020–2027 (USD MILLION)
                                      TABLE 93 MEXICO: MARKET SIZE, BY PACKAGING TYPE, 2020–2027 (KILOTON)
                                      TABLE 94 MEXICO: MARKET SIZE, BY MATERIAL, 2020–2027 (USD MILLION)
                                      TABLE 95 MEXICO: MARKET SIZE, BY MATERIAL, 2020–2027 (KILOTON)
                                      TABLE 96 MEXICO: MARKET SIZE, BY APPLICATION, 2020–2027 (USD MILLION)
                                      TABLE 97 MEXICO: MARKET SIZE, BY APPLICATION, 2020–2027 (KILOTON)
     11.4 EUROPE 
             TABLE 98 EUROPE: FLEXIBLE PACKAGING MARKET SIZE, BY COUNTRY, 2020–2027 (USD MILLION)
             TABLE 99 EUROPE: MARKET SIZE, BY COUNTRY, 2020–2027 (KILOTON)
             TABLE 100 EUROPE: MARKET SIZE, BY PACKAGING TYPE, 2020–2027 (USD MILLION)
             TABLE 101 EUROPE: MARKET SIZE, BY PACKAGING TYPE, 2020–2027 (KILOTON)
             TABLE 102 EUROPE: MARKET SIZE, BY MATERIAL, 2020–2027 (USD MILLION)
             TABLE 103 EUROPE: MARKET SIZE, BY MATERIAL, 2020–2027 (KILOTON)
             TABLE 104 EUROPE: MARKET SIZE, BY APPLICATION, 2020–2027 (USD MILLION)
             TABLE 105 EUROPE: MARKET SIZE, BY APPLICATION, 2020–2027 (KILOTON)
             TABLE 106 EUROPE: MARKET SIZE, BY PRINTING TECHNOLOGY, 2020–2027 (USD MILLION)
             TABLE 107 EUROPE: MARKET SIZE, BY PRINTING TECHNOLOGY, 2020–2027 (KILOTON)
             11.4.1 GERMANY
                        11.4.1.1 Market growth due to high demand for pharmaceutical packaging
                                      TABLE 108 GERMANY: FLEXIBLE PACKAGING MARKET SIZE, BY PACKAGING TYPE, 2020–2027 (USD MILLION)
                                      TABLE 109 GERMANY: MARKET SIZE, BY PACKAGING TYPE, 2020–2027 (KILOTON)
                                      TABLE 110 GERMANY: MARKET SIZE, BY MATERIAL, 2020–2027 (USD MILLION)
                                      TABLE 111 GERMANY: MARKET SIZE, BY MATERIAL, 2020–2027 (KILOTON)
                                      TABLE 112 GERMANY: MARKET SIZE, BY APPLICATION, 2020–2027 (USD MILLION)
                                      TABLE 113 GERMANY: MARKET SIZE, BY APPLICATION, 2020–2027 (KILOTON)
             11.4.2 UK
                        11.4.2.1 Growth of healthcare industry to offer lucrative opportunities
                                      TABLE 114 UK: FLEXIBLE PACKAGING MARKET SIZE, BY PACKAGING TYPE, 2020–2027 (USD MILLION)
                                      TABLE 115 UK: MARKET SIZE, BY PACKAGING TYPE, 2020–2027 (KILOTON)
                                      TABLE 116 UK: MARKET SIZE, BY MATERIAL, 2020–2027 (USD MILLION)
                                      TABLE 117 UK: MARKET SIZE, BY MATERIAL, 2020–2027 (KILOTON)
                                      TABLE 118 UK: MARKET SIZE, BY APPLICATION, 2020–2027 (USD MILLION)
                                      TABLE 119 UK: MARKET SIZE, BY APPLICATION, 2020–2027 (KILOTON)
             11.4.3 FRANCE
                        11.4.3.1 Growing pharmaceutical industry to boost market
                                      TABLE 120 FRANCE: FLEXIBLE PACKAGING MARKET SIZE, BY PACKAGING TYPE, 2020–2027 (USD MILLION)
                                      TABLE 121 FRANCE: MARKET SIZE, BY PACKAGING TYPE, 2020–2027 (KILOTON)
                                      TABLE 122 FRANCE: MARKET SIZE, BY MATERIAL, 2020–2027 (USD MILLION)
                                      TABLE 123 FRANCE: MARKET SIZE, BY MATERIAL, 2020–2027 (KILOTON)
                                      TABLE 124 FRANCE: MARKET SIZE, BY APPLICATION, 2020–2027 (USD MILLION)
                                      TABLE 125 FRANCE: MARKET SIZE, BY APPLICATION, 2020–2027 (KILOTON)
             11.4.4 RUSSIA
                        11.4.4.1 Rising demand from various end-use industries to drive market
                                      TABLE 126 RUSSIA: FLEXIBLE PACKAGING MARKET SIZE, BY PACKAGING TYPE, 2020–2027 (USD MILLION)
                                      TABLE 127 RUSSIA: MARKET SIZE, BY PACKAGING TYPE, 2020–2027 (KILOTON)
                                      TABLE 128 RUSSIA: MARKET SIZE, BY MATERIAL, 2020–2027 (USD MILLION)
                                      TABLE 129 RUSSIA: MARKET SIZE, BY MATERIAL, 2020–2027 (KILOTON)
                                      TABLE 130 RUSSIA: MARKET SIZE, BY APPLICATION, 2020–2027 (USD MILLION)
                                      TABLE 131 RUSSIA: MARKET SIZE, BY APPLICATION, 2020–2027 (KILOTON)
             11.4.5 ITALY
                        11.4.5.1 Rising demand from retail, food, and healthcare industries to drive market
                                      TABLE 132 ITALY: FLEXIBLE PACKAGING MARKET SIZE, BY PACKAGING TYPE, 2020–2027 (USD MILLION)
                                      TABLE 133 ITALY: MARKET SIZE, BY PACKAGING TYPE, 2020–2027 (KILOTON)
                                      TABLE 134 ITALY: MARKET SIZE, BY MATERIAL, 2020–2027 (USD MILLION)
                                      TABLE 135 ITALY: MARKET SIZE, BY MATERIAL, 2020–2027 (KILOTON)
                                      TABLE 136 ITALY: MARKET SIZE, BY APPLICATION, 2020–2027 (USD MILLION)
                                      TABLE 137 ITALY: MARKET SIZE, BY APPLICATION, 2020–2027 (KILOTON)
             11.4.6 SPAIN
                        11.4.6.1 Increase in demand from retail, home & personal care, pharmaceutical, and food & beverage industries to drive market
                                      TABLE 138 SPAIN: FLEXIBLE PACKAGING MARKET SIZE, BY PACKAGING TYPE, 2020–2027 (USD MILLION)
                                      TABLE 139 SPAIN: MARKET SIZE, BY PACKAGING TYPE, 2020–2027 (KILOTON)
                                      TABLE 140 SPAIN: MARKET SIZE, BY MATERIAL, 2020–2027 (USD MILLION)
                                      TABLE 141 SPAIN: ARKET SIZE, BY MATERIAL, 2020–2027 (KILOTON)
                                      TABLE 142 SPAIN: MARKET SIZE, BY APPLICATION, 2020–2027 (USD MILLION)
                                      TABLE 143 SPAIN: MARKET SIZE, BY APPLICATION, 2020–2027 (KILOTON)
             11.4.7 REST OF EUROPE
                        TABLE 144 REST OF EUROPE: FLEXIBLE PACKAGING MARKET SIZE, BY PACKAGING TYPE, 2020–2027 (USD MILLION)
                        TABLE 145 REST OF EUROPE: MARKET SIZE, BY PACKAGING TYPE, 2020–2027 (KILOTON)
                        TABLE 146 REST OF EUROPE: MARKET SIZE, BY MATERIAL, 2020–2027 (USD MILLION)
                        TABLE 147 REST OF EUROPE: MARKET SIZE, BY MATERIAL, 2020–2027 (KILOTON)
                        TABLE 148 REST OF EUROPE: MARKET SIZE, BY APPLICATION, 2020–2027 (USD MILLION)
                        TABLE 149 REST OF EUROPE: MARKET SIZE, BY APPLICATION, 2020–2027 (KILOTON)
     11.5 MIDDLE EAST 
             TABLE 150 MIDDLE EAST: FLEXIBLE PACKAGING MARKET SIZE, BY COUNTRY, 2020–2027 (USD MILLION)
             TABLE 151 MIDDLE EAST: MARKET SIZE, BY COUNTRY, 2020–2027 (KILOTON)
             TABLE 152 MIDDLE EAST: MARKET SIZE, BY PACKAGING TYPE, 2020–2027 (USD MILLION)
             TABLE 153 MIDDLE EAST: MARKET SIZE, BY PACKAGING TYPE, 2020–2027 (KILOTON)
             TABLE 154 MIDDLE EAST: MARKET SIZE, BY MATERIAL, 2020–2027 (USD MILLION)
             TABLE 155 MIDDLE EAST: MARKET SIZE, BY MATERIAL, 2020–2027 (KILOTON)
             TABLE 156 MIDDLE EAST: MARKET SIZE, BY APPLICATION, 2020–2027 (USD MILLION)
             TABLE 157 MIDDLE EAST: MARKET SIZE, BY APPLICATION, 2020–2027 (KILOTON)
             TABLE 158 MIDDLE EAST: MARKET SIZE, BY PRINTING TECHNOLOGY, 2020–2027 (USD MILLION)
             TABLE 159 MIDDLE EAST: MARKET SIZE, BY PRINTING TECHNOLOGY, 2020–2027 (KILOTON)
             11.5.1 SAUDI ARABIA
                        11.5.1.1 Favorable trade agreements to support market growth
                                      TABLE 160 SAUDI ARABIA: FLEXIBLE PACKAGING MARKET SIZE, BY PACKAGING TYPE, 2020–2027 (USD MILLION)
                                      TABLE 161 SAUDI ARABIA: MARKET SIZE, BY PACKAGING TYPE, 2020–2027 (KILOTON)
                                      TABLE 162 SAUDI ARABIA: MARKET SIZE, BY MATERIAL, 2020–2027 (USD MILLION)
                                      TABLE 163 SAUDI ARABIA: MARKET SIZE, BY MATERIAL, 2020–2027 (KILOTON)
                                      TABLE 164 SAUDI ARABIA: MARKET SIZE, BY APPLICATION, 2020–2027 (USD MILLION)
                                      TABLE 165 SAUDI ARABIA: MARKET SIZE, BY APPLICATION, 2020–2027 (KILOTON)
             11.5.2 UAE
                        11.5.2.1 Growing packaged food consumption to propel market
                                      TABLE 166 UAE: FLEXIBLE PACKAGING MARKET SIZE, BY PACKAGING TYPE, 2020–2027 (USD MILLION)
                                      TABLE 167 UAE: MARKET SIZE, BY PACKAGING TYPE, 2020–2027 (KILOTON)
                                      TABLE 168 UAE: MARKET SIZE, BY MATERIAL, 2020–2027 (USD MILLION)
                                      TABLE 169 UAE: MARKET SIZE, BY MATERIAL, 2020–2027 (KILOTON)
                                      TABLE 170 UAE: MARKET SIZE, BY APPLICATION, 2020–2027 (USD MILLION)
                                      TABLE 171 UAE: MARKET SIZE, BY APPLICATION, 2020–2027 (KILOTON)
             11.5.3 REST OF MIDDLE EAST
                        TABLE 172 REST OF MIDDLE EAST: FLEXIBLE PACKAGING MARKET SIZE, BY PACKAGING TYPE, 2020–2027 (USD MILLION)
                        TABLE 173 REST OF MIDDLE EAST: MARKET SIZE, BY PACKAGING TYPE, 2020–2027 (KILOTON)
                        TABLE 174 REST OF MIDDLE EAST: MARKET SIZE, BY MATERIAL, 2020–2027 (USD MILLION)
                        TABLE 175 REST OF MIDDLE EAST: MARKET SIZE, BY MATERIAL, 2020–2027 (KILOTON)
                        TABLE 176 REST OF MIDDLE EAST: MARKET SIZE, BY APPLICATION, 2020–2027 (USD MILLION)
                        TABLE 177 REST OF MIDDLE EAST: MARKET SIZE, BY APPLICATION, 2020–2027 (KILOTON)
     11.6 AFRICA 
             TABLE 178 AFRICA: FLEXIBLE PACKAGING MARKET SIZE, BY COUNTRY, 2020–2027 (USD MILLION)
             TABLE 179 AFRICA: MARKET SIZE, BY COUNTRY, 2020–2027 (KILOTON)
             TABLE 180 AFRICA: MARKET SIZE, BY PACKAGING TYPE, 2020–2027 (USD MILLION)
             TABLE 181 AFRICA: MARKET SIZE, BY PACKAGING TYPE, 2020–2027 (KILOTON)
             TABLE 182 AFRICA: MARKET SIZE, BY APPLICATION, 2020–2027 (USD MILLION)
             TABLE 183 AFRICA: MARKET SIZE, BY APPLICATION, 2020–2027 (KILOTON)
             TABLE 184 AFRICA: MARKET SIZE, BY PRINTING TECHNOLOGY, 2020–2027 (USD MILLION)
             TABLE 185 AFRICA: MARKET SIZE, BY PRINTING TECHNOLOGY, 2020–2027 (KILOTON)
             TABLE 186 AFRICA: MARKET SIZE, BY MATERIAL, 2020–2027 (USD MILLION)
             TABLE 187 AFRICA: FLEXIBLE PAPER PACKAGING MARKET SIZE, BY MATERIAL, 2020–2027 (KILOTON)
             11.6.1 SOUTH AFRICA
                        11.6.1.1 Beverage industry to drive market
                                      TABLE 188 SOUTH AFRICA: FLEXIBLE PACKAGING MARKET SIZE, BY PACKAGING TYPE, 2020–2027 (USD MILLION)
                                      TABLE 189 SOUTH AFRICA: MARKET SIZE, BY PACKAGING TYPE, 2020–2027 (KILOTON)
                                      TABLE 190 SOUTH AFRICA: MARKET SIZE, BY APPLICATION, 2020–2027 (USD MILLION)
                                      TABLE 191 SOUTH AFRICA: MARKET SIZE, BY APPLICATION, 2020–2027 (KILOTON)
                                      TABLE 192 SOUTH AFRICA: MARKET SIZE, BY MATERIAL, 2020–2027 (USD MILLION)
                                      TABLE 193 SOUTH AFRICA: MARKET SIZE, BY MATERIAL, 2020–2027 (KILOTON)
             11.6.2 NIGERIA
                        11.6.2.1 Food processing industry to drive market
                                      TABLE 194 NIGERIA: FLEXIBLE PACKAGING MARKET SIZE, BY PACKAGING TYPE, 2020–2027 (USD MILLION)
                                      TABLE 195 NIGERIA: MARKET SIZE, BY PACKAGING TYPE, 2020–2027 (KILOTON)
                                      TABLE 196 NIGERIA: MARKET SIZE, BY APPLICATION, 2020–2027 (USD MILLION)
                                      TABLE 197 NIGERIA: MARKET SIZE, BY APPLICATION, 2020–2027 (KILOTON)
                                      TABLE 198 NIGERIA: MARKET SIZE, BY MATERIAL, 2020–2027 (USD MILLION)
                                      TABLE 199 NIGERIA: MARKET SIZE, BY MATERIAL, 2020–2027 (KILOTON)
             11.6.3 KENYA
                        11.6.3.1 Increasing demand for food to drive market
                                      TABLE 200 KENYA: MARKET SIZE, BY PACKAGING TYPE, 2020–2027 (USD MILLION)
                                      TABLE 201 KENYA: MARKET SIZE, BY PACKAGING TYPE, 2020–2027 (KILOTON)
                                      TABLE 202 KENYA: MARKET SIZE, BY APPLICATION, 2020–2027 (USD MILLION)
                                      TABLE 203 KENYA: MARKET SIZE, BY APPLICATION, 2020–2027 (KILOTON)
                                      TABLE 204 KENYA: MARKET SIZE, BY MATERIAL, 2020–2027 (USD MILLION)
                                      TABLE 205 KENYA: MARKET SIZE, BY MATERIAL, 2020–2027 (KILOTON)
             11.6.4 MOROCCO
                        11.6.4.1 Market driven by food processing industry
                                      TABLE 206 MOROCCO: MARKET SIZE, BY PACKAGING TYPE, 2020–2027 (USD MILLION)
                                      TABLE 207 MOROCCO: MARKET SIZE, BY PACKAGING TYPE, 2020–2027 (KILOTON)
                                      TABLE 208 MOROCCO: MARKET SIZE, BY APPLICATION, 2020–2027 (USD MILLION)
                                      TABLE 209 MOROCCO: MARKET SIZE, BY APPLICATION, 2020–2027 (KILOTON)
                                      TABLE 210 MOROCCO: MARKET SIZE, BY MATERIAL, 2020–2027 (USD MILLION)
                                      TABLE 211 MOROCCO: MARKET SIZE, BY MATERIAL, 2020–2027 (KILOTON)
             11.6.5 EGYPT
                        11.6.5.1 Growth of food processing industry to drive market
                                      TABLE 212 EGYPT: MARKET SIZE, BY PACKAGING TYPE, 2020–2027 (USD MILLION)
                                      TABLE 213 EGYPT: MARKET SIZE, BY PACKAGING TYPE, 2020–2027 (KILOTON)
                                      TABLE 214 EGYPT: MARKET SIZE, BY APPLICATION, 2020–2027 (USD MILLION)
                                      TABLE 215 EGYPT: MARKET SIZE, BY APPLICATION, 2020–2027 (KILOTON)
                                      TABLE 216 EGYPT: MARKET SIZE, BY MATERIAL, 2020–2027 (USD MILLION)
                                      TABLE 217 EGYPT: MARKET SIZE, BY MATERIAL, 2020–2027 (KILOTON)
             11.6.6 REST OF AFRICA
                        TABLE 218 REST OF AFRICA: MARKET SIZE, BY PACKAGING TYPE, 2020–2027 (USD MILLION)
                        TABLE 219 REST OF AFRICA: MARKET SIZE, BY PACKAGING TYPE, 2020–2027 (KILOTON)
                        TABLE 220 REST OF AFRICA: MARKET SIZE, BY APPLICATION, 2020–2027 (USD MILLION)
                        TABLE 221 REST OF AFRICA: MARKET SIZE, BY APPLICATION, 2020–2027 (KILOTON)
                        TABLE 222 REST OF AFRICA: MARKET SIZE, BY MATERIAL, 2020–2027 (USD MILLION)
                        TABLE 223 REST OF AFRICA: MARKET SIZE, BY MATERIAL, 2020–2027 (KILOTON)
     11.7 SOUTH AMERICA 
             TABLE 224 SOUTH AMERICA: MARKET SIZE, BY COUNTRY, 2020–2027 (USD MILLION)
             TABLE 225 SOUTH AMERICA: MARKET SIZE, BY COUNTRY, 2020–2027 (KILOTON)
             TABLE 226 SOUTH AMERICA: MARKET SIZE, BY PACKAGING TYPE, 2020–2027 (USD MILLION)
             TABLE 227 SOUTH AMERICA: MARKET SIZE, BY PACKAGING TYPE, 2020–2027 (KILOTON)
             TABLE 228 SOUTH AMERICA: MARKET SIZE, BY APPLICATION, 2020–2027 (USD MILLION)
             TABLE 229 SOUTH AMERICA: MARKET SIZE, BY APPLICATION, 2020–2027 (KILOTON)
             TABLE 230 SOUTH AMERICA: MARKET SIZE, BY PRINTING TECHNOLOGY, 2020–2027 (USD MILLION)
             TABLE 231 SOUTH AMERICA: MARKET SIZE, BY PRINTING TECHNOLOGY, 2020–2027 (KILOTON)
             TABLE 232 SOUTH AMERICA: MARKET SIZE, BY MATERIAL, 2020–2027 (USD MILLION)
             TABLE 233 SOUTH AMERICA: MARKET SIZE, BY MATERIAL, 2020–2027 (KILOTON)
             11.7.1 BRAZIL
                        11.7.1.1 Dominating market in region
                                      TABLE 234 BRAZIL: MARKET SIZE, BY PACKAGING TYPE, 2020–2027 (USD MILLION)
                                      TABLE 235 BRAZIL: MARKET SIZE, BY PACKAGING TYPE, 2020–2027 (KILOTON)
                                      TABLE 236 BRAZIL: MARKET SIZE, BY APPLICATION, 2020–2027 (USD MILLION)
                                      TABLE 237 BRAZIL: MARKET SIZE, BY APPLICATION, 2020–2027 (KILOTON)
                                      TABLE 238 BRAZIL: MARKET SIZE, BY MATERIAL, 2020–2027 (USD MILLION)
                                      TABLE 239 BRAZIL: MARKET SIZE, BY MATERIAL, 2020–2027 (KILOTON)
             11.7.2 ARGENTINA
                        11.7.2.1 Rising demand for food packaging to drive market
                                      TABLE 240 ARGENTINA:  MARKET SIZE, BY PACKAGING TYPE, 2020–2027 (USD MILLION)
                                      TABLE 241 ARGENTINA: MARKET SIZE, BY PACKAGING TYPE, 2020–2027 (KILOTON)
                                      TABLE 242 ARGENTINA: MARKET SIZE, BY APPLICATION, 2020–2027 (USD MILLION)
                                      TABLE 243 ARGENTINA: MARKET SIZE, BY APPLICATION, 2020–2027 (KILOTON)
                                      TABLE 244 ARGENTINA: MARKET SIZE, BY MATERIAL, 2020–2027 (USD MILLION)
                                      TABLE 245 ARGENTINA: MARKET SIZE, BY MATERIAL, 2020–2027 (KILOTON)
             11.7.3 REST OF SOUTH AMERICA
                        TABLE 246 REST OF SOUTH AMERICA:  MARKET SIZE, BY PACKAGING TYPE, 2020–2027 (USD MILLION)
                        TABLE 247 REST OF SOUTH AMERICA: MARKET SIZE, BY PACKAGING TYPE, 2020–2027 (KILOTON)
                        TABLE 248 REST OF SOUTH AMERICA: MARKET SIZE, BY APPLICATION, 2020–2027 (USD MILLION)
                        TABLE 249 REST OF SOUTH AMERICA: MARKET SIZE, BY APPLICATION, 2020–2027 (KILOTON)
                        TABLE 250 REST OF SOUTH AMERICA: MARKET SIZE, BY MATERIAL, 2020–2027 (USD MILLION)
                        TABLE 251 REST OF SOUTH AMERICA: MARKET SIZE, BY MATERIAL, 2020–2027 (KILOTON)
 
12 COMPETITIVE LANDSCAPE (Page No. - 187)
     12.1 OVERVIEW 
             FIGURE 31 COMPANIES ADOPTED NEW PRODUCT LAUNCHES AS KEY GROWTH STRATEGY BETWEEN 2019 AND 2022
     12.2 MARKET SHARE ANALYSIS 
             FIGURE 32  MARKET: MARKET SHARE ANALYSIS
     12.3 REVENUE ANALYSIS OF TOP MARKET PLAYERS 
             FIGURE 33 REVENUE ANALYSIS FOR KEY COMPANIES IN  MARKET
     12.4 COMPANY EVALUATION QUADRANT 
             12.4.1 STARS
             12.4.2 EMERGING LEADERS
             12.4.3 PARTICIPANTS
             12.4.4 PERVASIVE COMPANIES
                        FIGURE 34 COMPETITIVE LEADERSHIP MAPPING:  MARKET, 2021
     12.5 SME MATRIX, 2021 
             12.5.1 PROGRESSIVE COMPANIES
             12.5.2 RESPONSIVE COMPANIES
             12.5.3 DYNAMIC COMPANIES
             12.5.4 STARTING BLOCKS
                        FIGURE 35 SME MATRIX: MARKET, 2021
     12.6 COMPETITIVE SCENARIO 
             12.6.1 STRATEGIC DEVELOPMENTS
                        TABLE 252 STRATEGIC DEVELOPMENTS, 2018–2022
             12.6.2 PRODUCT LAUNCHES
                        TABLE 253 PRODUCT LAUNCHES, 2018–2022
 
13 COMPANY PROFILES (Page No. - 217)
     13.1 KEY PLAYERS 
(Business Overview, Products Offered, Recent Developments, Deals, Product launches, Others, MnM view, Right to win, Strategic overview, Weaknesses and competitive threats) *
             13.1.1 WESTROCK COMPANY
                        TABLE 254 WESTROCK COMPANY: COMPANY OVERVIEW
                        FIGURE 36 WESTROCK COMPANY: COMPANY SNAPSHOT
             13.1.2 BERRY GLOBAL GROUP, INC.
                        TABLE 255 BERRY GLOBAL GROUP, INC.: COMPANY OVERVIEW
                        FIGURE 37 BERRY GLOBAL GROUP, INC.: COMPANY SNAPSHOT
             13.1.3 AMCOR LIMITED
                        TABLE 256 AMCOR LIMITED: COMPANY OVERVIEW
                        FIGURE 38 AMCOR LIMITED: COMPANY SNAPSHOT
             13.1.4 MONDI GROUP
                        TABLE 257 MONDI GROUP: COMPANY OVERVIEW
                        FIGURE 39 MONDI GROUP: COMPANY SNAPSHOT
             13.1.5 SONOCO PRODUCTS COMPANY
                        TABLE 258 SONOCO PRODUCTS COMPANY: COMPANY OVERVIEW
                        FIGURE 40 SONOCO PRODUCTS COMPANY: COMPANY SNAPSHOT
             13.1.6 HUHTAMAKI OYJ
                        TABLE 259 HUHTAMAKI OYJ: COMPANY OVERVIEW
                        FIGURE 41 HUHTAMAKI OYJ: COMPANY SNAPSHOT
             13.1.7 CONSTANTIA FLEXIBLES
                        TABLE 260 CONSTANTIA FLEXIBLES: COMPANY OVERVIEW
                        FIGURE 42 CONSTANTIA FLEXIBLES: COMPANY SNAPSHOT
             13.1.8 SEALED AIR CORPORATION
                        TABLE 261 SEALED AIR CORPORATION: COMPANY OVERVIEW
                        FIGURE 43 SEALED AIR CORPORATION: COMPANY SNAPSHOT
             13.1.9 TRANSCONTINENTAL INC.
                        TABLE 262 TRANSCONTINENTAL INC.: COMPANY OVERVIEW
                        FIGURE 44 TRANSCONTINENTAL INC: COMPANY SNAPSHOT
             13.1.10 DS SMITH
                        TABLE 263 DS SMITH: COMPANY OVERVIEW
                        FIGURE 45 DS SMITH: COMPANY SNAPSHOT
     13.2 OTHER PLAYERS 
             13.2.1 NOVOLEX-CARLYLE GROUP
                        TABLE 264 NOVOLEX-CARLYLE GROUP: COMPANY OVERVIEW
             13.2.2 BISCHOF + KLEIN SE & CO. KG
                        TABLE 265 BISCHOF + KLEIN SE & CO. KG: COMPANY OVERVIEW
             13.2.3 UFLEX LIMITED
                        TABLE 266 UFLEX LIMITED: COMPANY OVERVIEW
             13.2.4 SILAFRICA
                        TABLE 267 SILAFRICA: COMPANY OVERVIEW
             13.2.5 PROAMPAC
                        TABLE 268 PROAMPAC: COMPANY OVERVIEW
             13.2.6 ALUFLEXPACK AG
                        TABLE 269 ALUFLEXPACK AG: COMPANY OVERVIEW
             13.2.7 PPC FLEXIBLE PACKAGING LLC.
                        TABLE 270 PPC FLEXIBLE PACKAGING LLC.: COMPANY OVERVIEW
             13.2.8 PRINTPACK, INC.
                        TABLE 271 PRINTPACK, INC.: COMPANY OVERVIEW
             13.2.9 NOVUS HOLDINGS LTD.
                        TABLE 272 NOVUS HOLDINGS LTD.: COMPANY OVERVIEW
             13.2.10 AHLSTROM
                        TABLE 273 AHLSTROM: COMPANY OVERVIEW
             13.2.11 COSMO FILMS LIMITED
                        TABLE 274 COSMO FILMS LIMITED: COMPANY OVERVIEW
             13.2.12 LINEAR PLASTICS AND PACKAGING.
                        TABLE 275 LINEAR PLASTICS AND PACKAGING: COMPANY OVERVIEW
             13.2.13 WIHURI GROUP
                        TABLE 276 WIHURI GROUP: COMPANY OVERVIEW
             13.2.14 GUALA PACK S.P.A.
                        TABLE 277 GUALA PACK S.P.A.: COMPANY OVERVIEW
             13.2.15 C-P FLEXIBLE PACKAGING
                        TABLE 278 C-P FLEXIBLE PACKAGING: COMPANY OVERVIEW
 
*Details on Business Overview, Products Offered, Recent Developments, Deals, Product launches, Others, MnM view, Right to win, Strategic overview, Weaknesses and competitive threats might not be captured in case of unlisted companies.
 
14 APPENDIX (Page No. - 283)
     14.1 DISCUSSION GUIDE 
     14.2 KNOWLEDGESTORE: MARKETSANDMARKETS’ SUBSCRIPTION PORTAL 
     14.3 CUSTOMIZATION OPTIONS 
     14.4 RELATED REPORTS 
     14.5 AUTHOR DETAILS 

This research involved the use of extensive secondary sources and databases, such as Factiva and Bloomberg, to identify and collect information useful for a technical and market-oriented study of the flexible packing market. Primary sources included industry experts from related industries and preferred suppliers, manufacturers, distributors, technologists, standards & certification organizations, and organizations related to all segments of the value chain of this industry. In-depth interviews have been conducted with various primary respondents, such as key industry participants, subject matter experts (SMEs), executives of key companies, and industry consultants, to obtain and verify critical qualitative and quantitative information as well as to assess growth prospects.

Flexible Packaging Market Secondary Research

In the secondary research process, various sources such as annual reports, press releases, and investor presentations of companies, white papers, and publications from recognized websites and databases have been referred to for identifying and collecting information. Secondary research has been used to obtain key information about the industry's supply chain, the total pool of key players, market classification and segmentation according to the industry trends to the bottom-most level, regional markets, and key developments from both market-and technology-oriented perspectives.

Flexible Packaging Market Primary Research

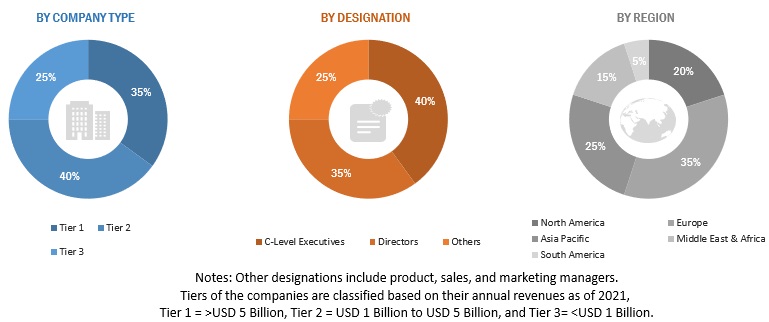
The flexible packaging market comprises several stakeholders in the supply chain, which include suppliers, processors, and end-product manufacturers. Various primary sources from the supply and demand sides of the markets have been interviewed to obtain qualitative and quantitative information. The primary participants from the demand side include key opinion leaders, executives, vice presidents, and CEOs of companies in the flexible packaging market. Primary sources from the supply side include associations and institutions involved in the flexible packaging industry, key opinion leaders, and processing players.Following is the breakdown of primary respondents
Flexible Packaging Market Size, and Share

To know about the assumptions considered for the study, download the pdf brochure

Flexible Packaging Market Size Estimation

Both top-down and bottom-up approaches were used to estimate and validate the size of the global flexible packaging market. The research methodology used to estimate the market size includes the following:

  • The key players in the industry were identified through extensive secondary research.
  • The supply chain of the industry and market size, in terms of value, were determined through primary and secondary research.
  • All percentage share split, and breakdowns were determined using secondary sources and verified through primary sources.
  • All possible parameters that affect the markets covered in this research study were accounted for, viewed in extensive detail, verified through primary research, and analyzed to obtain the final quantitative and qualitative data.
  • The research includes the study of reports, reviews, and newsletters of key industry players, along with extensive interviews with key officials, such as directors and marketing executives.

Market Size Estimation: Bottom-Up Approach and Top-Down Approach

Flexible Packaging Market Data Triangulation

After arriving at the total market size from the estimation process explained above, the overall market was split into several segments and subsegments. To complete the overall market size estimation process and arrive at the exact statistics for all segments and subsegments, data triangulation and market breakdown procedures have been employed, wherever applicable. The data have been triangulated by studying various factors and trends from both the demand and supply sides. In addition, the market size has been validated by using both the top-down and bottom-up approaches.

Flexible Packaging Market Report Objectives

  • To define, describe, and forecast the global flexible packaging market in terms of value
  • To provide insights regarding the significant factors influencing the growth of the market (drivers, restraints, opportunities, and challenges)
  • To analyze and forecast the market based on type, region, and end-use application.
  • To forecast the market size, in terms of value, with respect to six main regions: North America, Europe, South America, APAC, Middle East, and Africa.
  • To analyze the opportunities in the market for stakeholders and provide details of the competitive landscape
  • To strategically profile key players in the market
  • To analyze competitive developments in the market, such as new product launches, capacity expansions, and mergers & acquisitions
  • To strategically profile the leading players and comprehensively analyze their key developments in the market

The market has been further analyzed for the key countries in each of these regions.

Flexible Packaging Market Report Available Customizations

Along with the given market data, MarketsandMarkets offers customizations as per the specific needs of the companies. The following customization options are available for the report:

Product Analysis:

  • Product Matrix, which gives a detailed comparison of the product portfolio of each company

Flexible Packaging Market Regional Analysis

  • Further breakdown of the Rest of the APAC Flexible Packaging market
  • Further breakdown of the Rest of Europe's Flexible Packaging market

Flexible Packaging Market Company Information

  • Detailed analysis and profiling of additional market players (up to 5)
Custom Market Research Services

We will customize the research for you, in case the report listed above does not meet with your exact requirements. Our custom research will comprehensively cover the business information you require to help you arrive at strategic and profitable business decisions.

Request Customization

Instant Answers with GPT - Ask Now!

Ask real questions. Get complete answers !
Report Code
PK 8505
Published ON
Nov, 2022
Choose License Type
BUY NOW
  • SHARE
X
Request Customization
Speak to Analyst
Speak to Analyst
OR FACE-TO-FACE MEETING
PERSONALIZE THIS RESEARCH
  • Triangulate with your Own Data
  • Get Data as per your Format and Definition
  • Gain a Deeper Dive on a Specific Application, Geography, Customer or Competitor
  • Any level of Personalization
REQUEST A FREE CUSTOMIZATION
LET US HELP YOU!
  • What are the Known and Unknown Adjacencies Impacting the Flexible Packaging Market
  • What will your New Revenue Sources be?
  • Who will be your Top Customer; what will make them switch?
  • Defend your Market Share or Win Competitors
  • Get a Scorecard for Target Partners
CUSTOMIZED WORKSHOP REQUEST
+1-888-600-6441
  • Call Us
  • +1-888-600-6441 (Corporate office hours)
  • +1-888-600-6441 (US/Can toll free)
  • +44-800-368-9399 (UK office hours)
CONNECT WITH US
ABOUT TRUST ONLINE
©2024 MarketsandMarkets Research Private Ltd. All rights reserved
DMCA.com Protection Status Website Feedback