Phenolic Panel Market by Type (Sandwich, Plain), Class, End-Use Industry (Construction, Marine, Transportation, Aerospace & Defense), Application (Interior, Exterior, Furniture, Air Conditioning Duct Panel), Class, and Region - Global Forecast to 2025


Updated on : March 23, 2023
Phenolic Panel Market
Phenolic Panel Market was valued at USD 1.7 billion in 2020 and is projected to reach USD 2.4 billion by 2025, growing at a cagr 6.5% from 2020 to 2025. The phenolic panel industry is growing due to the rise in the demand from construction, aerospace & defense, and transportation industries.
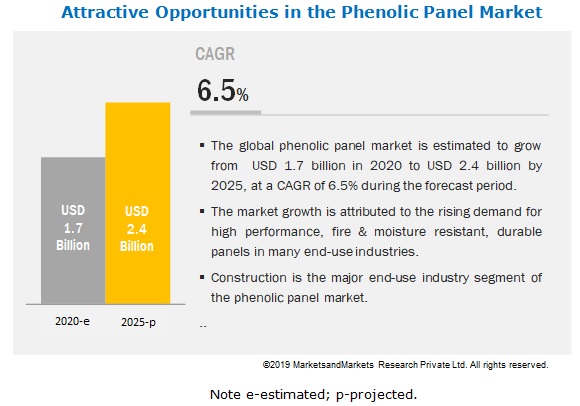
The construction industry has the largest market share in the global phenolic panel.
The construction end-use industry is the major industry in the global phenolic panel market on account of the high demand from both commercial and residential projects owing to growing concern towards fire-safety. Increased adoption of phenolic panels across elevator walls, decorative interior & exterior, escalator claddings, and balcony cladding, among others, are augmenting the growth of the phenolic panel market in the construction industry.
Interior application is the major segment of the market in terms of value.
Interior is the most prominent application of phenolic panel. Phenolic panels are used for interior applications in various industries, including construction, marine, and transportation. Phenolic panels offer superior fire resistance characteristics; hence they are gaining acceptance across the globe for interior application to avoid fire-related accidents.
Sandwich type is the fastest-growing application segment of the phenolic panel market in terms of value.
Sandwich type phenolic panel holds the majority of the market share owing to high demand from construction, transportation, marine, and aerospace & defense industries. Increasing implementation of aluminum-based phenolic panels across various applications, including furniture, air conditioning duct panel, floor, partitions, etc. are responsible for the high growth of the sandwich segment.
Class A phenolic panel is the fastest-growing segment of the phenolic panel market in terms of value.
Class A dominated the phenolic panel market in the class segment. Class A phenolic panels are heavily used for interior, exterior, and other applications owing to their superior fire resistance characteristics. Owing to the lower Flame Spread Index (FSI), these panels are witnessing a high demand from the North America and European market.
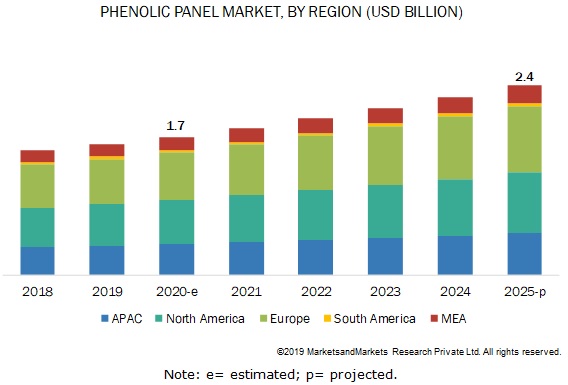
Europe held the largest market share in the phenolic panel market in 2019.
Europe is the major consumer of phenolic panels owing to high demand from the UK, Germany, and other European countries. Major applications of phenolic panels in the European market include building interior, aircraft interior, exterior cladding, furniture, and air conditioning duct panels, among others. Advancements in technology, regulatory policies, and government norms are some of the major factors driving the phenolic panel market in Europe.
Phenolic Panel Market Players
The key players in the global phenolic panel market are Kingspan Group (Ireland), Wilsonart LLC(US), Asahi Kasei Corporation (Japan), Fiberesin Industries Inc. (US), Broadview Holding B.V. (Netherlands), Fundermax GmbH (Austria), Bobrick Washroom Equipment, Inc. (US), Werzalit of America, Inc. (US), ASI Group (US), and General Partitions Mfg. Corp. (US). These companies are involved in adopting various inorganic and organic strategies to increase their foothold in the phenolic panel industry. The study includes an in-depth competitive analysis of these companies in the phenolic panel market, with their company profiles, recent developments, and key market strategies.
Phenolic Panel Market Report Scope
|
Report Metric |
Details |
|
Years Considered for the study |
2020–2025 |
|
Base year |
2019 |
|
Forecast period |
2020–2025 |
|
Units considered |
Value (USD), Volume (Thousand Square Meter) |
|
Segments |
Type, Class, Application, End-use Industry, and Region |
|
Regions |
Europe, North America, APAC, MEA, and South America |
|
Companies |
Kingspan Group (Ireland), Wilsonart LLC (US), Asahi Kasei Corporation (Japan), Fiberesin Industries Inc. (US), Broadview Holding B.V. (Netherlands), Fundermax GmbH (Austria), Bobrick Washroom Equipment, Inc. (US), Werzalit of America, Inc. (US), ASI Group (US), and General Partitions Mfg. Corp. (US) |
By Type:
- Sandwich
- Plain
By Class:
- Class A
- Class B
- Others
By Application:
- Interior
- Exterior
- Furniture
- Air Conditioning Duct Panel
- Others
By End-use Industry:
- Construction
- Marine
- Transportation
- Aerospace & Defense
- Others
By Region:
- North America
- Europe
- APAC
- MEA
- South America
Recent Developments
- In April 2017, Kingspan Group added two new products to its Kooltherm K100 range; the K112 Framing Board and K107 Pitched Roof Board. These insulation boards deliver low U-values with minimal thickness.
- In June 2019, Broadview Holding acquired Cincinnati-based Formica Group from Fletcher Building Ltd. This acquisition has helped Broadview Holding to increase its presence in Europe, North America, and Asia.
Key Questions Addressed By the Report
- Which are the major end-use industries of phenolic panels?
- Which industry is the major consumer of phenolic panels?
- Which region is the largest and fastest-growing market for phenolic panels?
- What is the major type in which phenolic panel?
- What are the major applications of phenolic panels?
- What are the major strategies adopted by leading market players?
To speak to our analyst for a discussion on the above findings, click Speak to Analyst
TABLE OF CONTENTS
1 INTRODUCTION (Page No. - 17)
1.1 OBJECTIVES OF THE STUDY
1.2 MARKET DEFINITION
1.3 MARKET SCOPE
1.3.1 MARKET SEGMENTATION
1.3.2 REGIONS COVERED
1.3.3 YEARS CONSIDERED FOR THE STUDY
1.4 CURRENCY
1.5 UNIT CONSIDERED
1.6 STAKEHOLDERS
2 RESEARCH METHODOLOGY (Page No. - 20)
2.1 RESEARCH DATA
2.1.1 SECONDARY DATA
2.1.1.1 Key data from secondary sources
2.1.2 PRIMARY DATA
2.1.2.1 Key data from primary sources
2.1.2.2 Key industry insights
2.1.2.3 Breakdown of primary interviews
2.2 MARKET SIZE ESTIMATION
2.2.1 SUPPLY-SIDE ANALYSIS
2.2.2 DEMAND-SIDE ANALYSIS
2.3 DATA TRIANGULATION
2.4 LIMITATIONS
2.5 ASSUMPTIONS
3 EXECUTIVE SUMMARY (Page No. - 28)
4 PREMIUM INSIGHTS (Page No. - 32)
4.1 ATTRACTIVE OPPORTUNITIES IN THE PHENOLIC PANEL MARKET
4.2 PHENOLIC PANEL MARKET, BY APPLICATION AND REGION, 2019
4.3 PHENOLIC PANEL MARKET, BY END-USE INDUSTRY
4.4 PHENOLIC PANEL MARKET, BY TYPE
4.5 PHENOLIC PANEL MARKET, BY FORM
4.6 PHENOLIC PANEL MARKET, BY KEY COUNTRIES
5 MARKET OVERVIEW (Page No. - 35)
5.1 INTRODUCTION
5.2 MARKET DYNAMICS
5.2.1 DRIVERS
5.2.1.1 Superior fire-resistant properties
5.2.1.2 Need for quality products in the construction industry
5.2.2 RESTRAINTS
5.2.2.1 High pricing of phenolic panels
5.2.2.2 Declining economy due to COVID-19
5.2.3 OPPORTUNITIES
5.2.3.1 Increasing construction spending
5.2.4 CHALLENGES
5.2.4.1 Lack of awareness about phenolic panels among end users
5.3 PORTER’S FIVE FORCES ANALYSIS
5.3.1 THREAT OF NEW ENTRANTS
5.3.2 THREAT OF SUBSTITUTES
5.3.3 BARGAINING POWER OF SUPPLIERS
5.3.4 BARGAINING POWER OF BUYERS
5.3.5 INTENSITY OF COMPETITIVE RIVALRY
6 PHENOLIC PANEL MARKET, BY CLASS TYPE (Page No. - 39)
6.1 INTRODUCTION
6.2 CLASS A
6.2.1 CLASS A PHENOLIC PANEL MARKET SIZE, BY REGION
6.3 CLASS B
6.3.1 CLASS B PHENOLIC PANEL MARKET SIZE, BY REGION
6.4 OTHERS
6.4.1 OTHER PHENOLIC PANELS MARKET SIZE, REGION
7 PHENOLIC PANEL MARKET, BY TYPE (Page No. - 45)
7.1 INTRODUCTION
7.2 SANDWICH
7.2.1 SANDWICH TYPE PHENOLIC PANEL MARKET SIZE, BY REGION
7.2.2 SANDWICH PHENOLIC PANEL MARKET SIZE, BY SHEET MATERIAL
7.3 PLAIN
7.3.1 PLAIN PHENOLIC PANEL MARKET SIZE, BY REGION
8 PHENOLIC PANEL MARKET, BY END-USE INDUSTRY (Page No. - 50)
8.1 INTRODUCTION
8.2 CONSTRUCTION
8.2.1 PHENOLIC PANEL MARKET SIZE IN CONSTRUCTION INDUSTRY, BY REGION
8.3 MARINE
8.3.1 PHENOLIC PANEL MARKET SIZE IN MARINE INDUSTRY, BY REGION
8.4 TRANSPORTATION
8.4.1 PHENOLIC PANEL MARKET SIZE IN TRANSPORTATION INDUSTRY, BY REGION
8.5 AEROSPACE & DEFENSE
8.5.1 PHENOLIC PANEL MARKET SIZE IN AEROSPACE & DEFENSE INDUSTRY, BY REGION
8.6 OTHERS
8.6.1 PHENOLIC PANEL MARKET SIZE IN OTHER INDUSTRIES, BY REGION
9 PHENOLIC PANEL MARKET, BY APPLICATION (Page No. - 58)
9.1 INTRODUCTION
9.2 INTERIOR
9.2.1 PHENOLIC PANEL MARKET SIZE IN INTERIOR APPLICATION, BY REGION
9.3 EXTERIOR
9.3.1 PHENOLIC PANEL MARKET SIZE IN EXTERIOR APPLICATION, BY REGION
9.4 FURNITURE
9.4.1 PHENOLIC PANEL MARKET SIZE IN FURNITURE APPLICATION, BY REGION
9.5 AIR CONDITIONING DUCT PANEL
9.5.1 PHENOLIC PANEL MARKET SIZE IN AIR CONDITIONING DUCT PANEL APPLICATION, BY REGION
9.6 OTHERS
9.6.1 PHENOLIC PANEL MARKET SIZE IN OTHER APPLICATIONS, BY REGION
10 REGIONAL ANALYSIS (Page No. - 66)
10.1 INTRODUCTION
10.2 NORTH AMERICA
10.2.1 NORTH AMERICA, BY END-USE INDUSTRY
10.2.2 NORTH AMERICA, BY APPLICATION
10.2.3 NORTH AMERICA, BY CLASS
10.2.4 NORTH AMERICA, BY TYPE
10.2.5 NORTH AMERICA, BY COUNTRY
10.2.5.1 US
10.2.5.2 Canada
10.2.5.3 Mexico
10.3 EUROPE
10.3.1 EUROPE, BY END-USE INDUSTRY
10.3.2 EUROPE, BY APPLICATION
10.3.3 EUROPE, BY CLASS
10.3.4 EUROPE, BY TYPE
10.3.5 EUROPE, BY COUNTRY
10.3.5.1 Germany
10.3.5.2 UK
10.3.5.3 France
10.3.5.4 Italy
10.4 APAC
10.4.1 APAC, BY END-USE INDUSTRY
10.4.2 APAC, BY APPLICATION
10.4.3 APAC, BY CLASS
10.4.4 APAC, BY TYPE
10.4.5 APAC, BY COUNTRY
10.4.5.1 China
10.4.5.2 Japan
10.4.5.3 South Korea
10.5 SOUTH AMERICA
10.5.1 SOUTH AMERICA, BY END-USE INDUSTRY
10.5.2 SOUTH AMERICA, BY APPLICATION
10.5.3 SOUTH AMERICA, BY CLASS
10.5.4 SOUTH AMERICA, BY TYPE
10.5.5 SOUTH AMERICA, BY COUNTRY
10.5.5.1 Brazil
10.5.5.2 Chile
10.6 MEA
10.6.1 MEA, BY END-USE INDUSTRY
10.6.2 MEA, BY APPLICATION
10.6.3 MEA, BY CLASS
10.6.4 MEA, BY TYPE
10.6.5 MEA, BY COUNTRY
10.6.5.1 UAE
10.6.5.2 Saudi Arabia
11 COMPETITIVE LANDSCAPE (Page No. - 92)
11.1 INTRODUCTION
11.2 COMPETITIVE LEADERSHIP MAPPING
11.2.1 VISIONARY LEADERS
11.2.2 DYNAMIC DIFFERENTIATORS
11.2.3 INNOVATORS
11.2.4 EMERGING COMPANIES
11.3 STRENGTH OF PRODUCT PORTFOLIO
11.4 BUSINESS STRATEGY EXCELLENCE
11.5 MARKET RANKING
11.6 COMPETITIVE SCENARIO
11.6.1 NEW PRODUCT DEVELOPMENTS/LAUNCHES
11.6.2 EXPANSIONS
11.6.3 ACQUISITIONS
12 COMPANY PROFILES (Page No. - 99)
12.1 KINGSPAN GROUP
(Business Overview, Products Offered, Recent Developments, SWOT Analysis, Winning Imperative, Current Focus and Strategies, Threat From Competition, and Right to Win)
12.2 BROADVIEW HOLDING B.V.
12.3 FIBERESIN INDUSTRIES, INC.
12.4 WILSONART LLC
12.5 ASAHI KASEI CORPORATION
12.6 FUNDERMAX GMBH
12.7 ASI GROUP
12.8 GENERAL PARTITIONS MFG. CORP.
12.9 WERZALIT OF AMERICA, INC.
12.10 BOBRICK WASHROOM EQUIPMENT, INC.
12.11 OTHER COMPANIES
12.11.1 SPIGO GROUP
12.11.2 GUANGDONG YUHUA BUILDING MATERIALS CO., LTD. (JIALIFU)
12.11.3 XTRATHERM LIMITED
12.11.4 MILWAUKEE COMPOSITES INCORPORATED
12.11.5 PEARL INDUSTRIES LLC
12.11.6 STO SAS
12.11.7 ARTBOARD AB
12.11.8 AMERICAN ARCHITECTURAL MILLWORK
12.11.9 SMYTH COMPOSITES LIMITED
12.11.10 ALPHA DUCTS LLC
*Details on Business Overview, Products Offered, Recent Developments, SWOT Analysis, Winning Imperative, Current Focus and Strategies, Threat From Competition, and Right to Win might not be captured in case of unlisted companies.
13 APPENDIX (Page No. - 122)
13.1 DISCUSSION GUIDE
13.2 KNOWLEDGE STORE: MARKETSANDMARKETS’ SUBSCRIPTION PORTAL
13.3 AVAILABLE CUSTOMIZATIONS
13.4 RELATED REPORTS
13.5 AUTHOR DETAILS
LIST OF TABLES (95 Tables)
TABLE 1 PHENOLIC PANEL MARKET SIZE, BY CLASS TYPE, 2018–2025 (THOUSAND SQUARE METER)
TABLE 2 PHENOLIC PANEL MARKET SIZE, BY CLASS TYPE, 2018–2025 (USD MILLION)
TABLE 3 CLASS A PHENOLIC PANEL MARKET SIZE, BY REGION, 2018–2025 (THOUSAND SQUARE METER)
TABLE 4 CLASS A PHENOLIC PANEL MARKET SIZE, BY REGION, 2018–2025 (USD MILLION)
TABLE 5 CLASS B PHENOLIC PANEL MARKET SIZE, BY REGION, 2018–2025 (THOUSAND SQUARE METER)
TABLE 6 CLASS B PHENOLIC PANEL MARKET SIZE, BY REGION, 2018–2025 (USD MILLION)
TABLE 7 OTHERS PHENOLIC PANELS MARKET SIZE, BY REGION, 2018–2025 (THOUSAND SQUARE METER)
TABLE 8 OTHERS PHENOLIC PANELS MARKET SIZE, BY REGION, 2018–2025 (USD MILLION)
TABLE 9 PHENOLIC PANEL MARKET SIZE, BY TYPE, 2018–2025 (THOUSAND SQUARE METER)
TABLE 10 PHENOLIC PANEL MARKET SIZE, BY TYPE, 2018–2025 (USD MILLION)
TABLE 11 SANDWICH PHENOLIC PANEL MARKET SIZE, BY REGION, 2018–2025 (THOUSAND SQUARE METER)
TABLE 12 SANDWICH PHENOLIC PANEL MARKET SIZE, BY REGION, 2018–2025 (USD MILLION)
TABLE 13 SANDWICH PHENOLIC PANEL MARKET SIZE, BY SHEET MATERIAL, 2018–2025 (THOUSAND SQUARE METER)
TABLE 14 SANDWICH PHENOLIC PANEL MARKET SIZE, BY SHEET MATERIAL, 2018–2025 (USD MILLION)
TABLE 15 PLAIN PHENOLIC PANEL MARKET SIZE, BY REGION, 2018–2025 (THOUSAND SQUARE METER)
TABLE 16 PLAIN PHENOLIC PANEL MARKET SIZE, BY REGION, 2018–2025 (USD MILLION)
TABLE 17 PHENOLIC PANEL MARKET SIZE, BY END-USE INDUSTRY, 2018–2025 (THOUSAND SQUARE METER)
TABLE 18 PHENOLIC PANEL MARKET SIZE, BY END-USE INDUSTRY, 2018–2025 (USD MILLION)
TABLE 19 PHENOLIC PANEL MARKET SIZE IN CONSTRUCTION INDUSTRY, BY REGION, 2018–2025 (THOUSAND SQUARE METER)
TABLE 20 PHENOLIC PANEL MARKET SIZE IN CONSTRUCTION INDUSTRY, BY REGION, 2018–2025 (USD MILLION)
TABLE 21 PHENOLIC PANEL MARKET SIZE IN MARINE INDUSTRY, BY REGION, 2018–2025 (THOUSAND SQUARE METER)
TABLE 22 PHENOLIC PANEL MARKET SIZE IN MARINE INDUSTRY, BY REGION, 2018–2025 (USD MILLION)
TABLE 23 PHENOLIC PANEL MARKET SIZE IN TRANSPORTATION INDUSTRY, BY REGION, 2018–2025 (THOUSAND SQUARE METER)
TABLE 24 PHENOLIC PANEL MARKET SIZE IN TRANSPORTATION INDUSTRY, BY REGION, 2018–2025 (USD MILLION)
TABLE 25 PHENOLIC PANEL MARKET SIZE IN AEROSPACE & DEFENSE INDUSTRY, BY REGION, 2018–2025 (THOUSAND SQUARE METER)
TABLE 26 PHENOLIC PANEL MARKET SIZE IN AEROSPACE & DEFENSE INDUSTRY, BY REGION, 2018–2025 (USD MILLION)
TABLE 27 PHENOLIC PANEL MARKET SIZE IN OTHER INDUSTRIES, BY REGION, 2018–2025 (THOUSAND SQUARE METER)
TABLE 28 PHENOLIC PANEL MARKET SIZE IN OTHER INDUSTRIES, BY REGION, 2018–2025 (USD MILLION)
TABLE 29 PHENOLIC PANEL MARKET SIZE, BY APPLICATION, 2018–2025 (THOUSAND SQUARE METER)
TABLE 30 PHENOLIC PANEL MARKET SIZE, BY APPLICATION, 2018–2025 (USD MILLION)
TABLE 31 PHENOLIC PANEL MARKET SIZE IN INTERIOR APPLICATION, BY REGION, 2018–2025 (THOUSAND SQUARE METER)
TABLE 32 PHENOLIC PANEL MARKET SIZE IN INTERIOR APPLICATION, BY REGION, 2018–2025 (USD MILLION)
TABLE 33 PHENOLIC PANEL MARKET SIZE IN EXTERIOR APPLICATION, BY REGION, 2018–2025 (THOUSAND SQUARE METER)
TABLE 34 PHENOLIC PANEL MARKET SIZE IN EXTERIOR APPLICATION, BY REGION, 2018–2025 (USD MILLION)
TABLE 35 PHENOLIC PANEL MARKET SIZE IN FURNITURE APPLICATION, BY REGION, 2018–2025 (THOUSAND SQUARE METER)
TABLE 36 PHENOLIC PANEL MARKET SIZE IN FURNITURE APPLICATION, BY REGION, 2018–2025 (USD MILLION)
TABLE 37 PHENOLIC PANEL MARKET SIZE IN AIR CONDITIONING DUCT PANEL APPLICATION, BY REGION, 2018–2025 (THOUSAND SQUARE METER)
TABLE 38 PHENOLIC PANEL MARKET SIZE IN AIR CONDITIONING DUCT PANEL APPLICATION, BY REGION, 2018–2025 (USD MILLION)
TABLE 39 PHENOLIC PANEL MARKET SIZE IN OTHER APPLICATIONS, BY REGION, 2018–2025 (THOUSAND SQUARE METER)
TABLE 40 PHENOLIC PANEL MARKET SIZE IN OTHER APPLICATIONS, BY REGION, 2018–2025 (USD MILLION)
TABLE 41 PHENOLIC PANEL MARKET SIZE, BY REGION, 2018–2025 (THOUSAND SQUARE METER)
TABLE 42 PHENOLIC PANEL MARKET SIZE, BY REGION, 2018–2025 (USD MILLION)
TABLE 43 NORTH AMERICA: PHENOLIC PANEL MARKET, BY END-USE INDUSTRY, 2018–2025 (THOUSAND SQUARE METER)
TABLE 44 NORTH AMERICA: PHENOLIC PANEL MARKET, BY END-USE INDUSTRY, 2018–2025 (USD MILLION)
TABLE 45 NORTH AMERICA: PHENOLIC PANEL MARKET, BY APPLICATION, 2018–2025 (THOUSAND SQUARE METER)
TABLE 46 NORTH AMERICA: PHENOLIC PANEL MARKET, BY APPLICATION, 2018–2025 (USD MILLION)
TABLE 47 NORTH AMERICA: PHENOLIC PANEL MARKET, BY CLASS, 2018–2025 (THOUSAND SQUARE METER)
TABLE 48 NORTH AMERICA: PHENOLIC PANEL MARKET, BY CLASS, 2018–2025 (USD MILLION)
TABLE 49 NORTH AMERICA: PHENOLIC PANEL MARKET, BY TYPE, 2018–2025 (THOUSAND SQUARE METER)
TABLE 50 NORTH AMERICA: PHENOLIC PANEL MARKET, BY TYPE, 2018–2025 (USD MILLION)
TABLE 51 NORTH AMERICA: PHENOLIC PANEL MARKET, BY COUNTRY, 2018–2025 (THOUSAND SQUARE METER)
TABLE 52 NORTH AMERICA: PHENOLIC PANEL MARKET, BY COUNTRY, 2018–2025 (USD MILLION)
TABLE 53 EUROPE: PHENOLIC PANEL MARKET, BY END-USE INDUSTRY, 2018–2025 (THOUSAND SQUARE METER)
TABLE 54 EUROPE: PHENOLIC PANEL MARKET, BY END-USE INDUSTRY, 2018–2025 (USD MILLION)
TABLE 55 EUROPE: PHENOLIC PANEL MARKET, BY APPLICATION, 2018–2025 (THOUSAND SQUARE METER)
TABLE 56 EUROPE: PHENOLIC PANEL MARKET, BY APPLICATION, 2018–2025 (USD MILLION)
TABLE 57 EUROPE: PHENOLIC PANEL MARKET, BY CLASS, 2018–2025 (THOUSAND SQUARE METER)
TABLE 58 EUROPE: PHENOLIC PANEL MARKET, BY CLASS, 2018–2025 (USD MILLION)
TABLE 59 EUROPE: PHENOLIC PANEL MARKET, BY TYPE, 2018–2025 (THOUSAND SQUARE METER)
TABLE 60 EUROPE: PHENOLIC PANEL MARKET, BY TYPE, 2018–2025 (USD MILLION)
TABLE 61 EUROPE: PHENOLIC PANEL MARKET, BY COUNTRY, 2018–2025 (THOUSAND SQUARE METER)
TABLE 62 EUROPE: PHENOLIC PANEL MARKET, BY COUNTRY, 2018–2025 (USD MILLION)
TABLE 63 APAC: PHENOLIC PANEL MARKET, BY END-USE INDUSTRY, 2018–2025 (THOUSAND SQUARE METER)
TABLE 64 APAC: PHENOLIC PANEL MARKET, BY END-USE INDUSTRY, 2018–2025 (USD MILLION)
TABLE 65 APAC: PHENOLIC PANEL MARKET, BY APPLICATION, 2018–2025 (THOUSAND SQUARE METER)
TABLE 66 APAC: PHENOLIC PANEL MARKET, BY APPLICATION, 2018–2025 (USD MILLION)
TABLE 67 APAC: PHENOLIC PANEL MARKET, BY CLASS, 2018–2025 (THOUSAND SQUARE METER)
TABLE 68 APAC: PHENOLIC PANEL MARKET, BY CLASS, 2018–2025 (USD MILLION)
TABLE 69 APAC: PHENOLIC PANEL MARKET, BY TYPE, 2018–2025 (THOUSAND SQUARE METER)
TABLE 70 APAC: PHENOLIC PANEL MARKET, BY TYPE, 2018–2025 (USD MILLION)
TABLE 71 APAC: PHENOLIC PANEL MARKET, BY COUNTRY, 2018–2025 (THOUSAND SQUARE METER)
TABLE 72 APAC: PHENOLIC PANEL MARKET, BY COUNTRY, 2018–2025 (USD MILLION)
TABLE 73 SOUTH AMERICA: PHENOLIC PANEL MARKET, BY END-USE INDUSTRY, 2018–2025 (THOUSAND SQUARE METER)
TABLE 74 SOUTH AMERICA: PHENOLIC PANEL MARKET, BY END-USE INDUSTRY, 2018–2025 (USD MILLION)
TABLE 75 SOUTH AMERICA: PHENOLIC PANEL MARKET, BY APPLICATION, 2018–2025 (THOUSAND SQUARE METER)
TABLE 76 SOUTH AMERICA: PHENOLIC PANEL MARKET, BY APPLICATION, 2018–2025 (USD MILLION)
TABLE 77 SOUTH AMERICA: PHENOLIC PANEL MARKET, BY CLASS, 2018–2025 (THOUSAND SQUARE METER)
TABLE 78 SOUTH AMERICA: PHENOLIC PANEL MARKET, BY CLASS, 2018–2025 (USD MILLION)
TABLE 79 SOUTH AMERICA: PHENOLIC PANEL MARKET, BY TYPE, 2018–2025 (THOUSAND SQUARE METER)
TABLE 80 SOUTH AMERICA: PHENOLIC PANEL MARKET, BY TYPE, 2018–2025 (USD MILLION)
TABLE 81 SOUTH AMERICA: PHENOLIC PANEL MARKET, BY COUNTRY, 2018–2025 (THOUSAND SQUARE METER)
TABLE 82 SOUTH AMERICA: PHENOLIC PANEL MARKET, BY COUNTRY, 2018–2025 (USD MILLION)
TABLE 83 MEA: PHENOLIC PANEL MARKET, BY END-USE INDUSTRY, 2018–2025 (THOUSAND SQUARE METER)
TABLE 84 MEA: PHENOLIC PANEL MARKET, BY END-USE INDUSTRY, 2018–2025 (USD MILLION)
TABLE 85 MEA: PHENOLIC PANEL MARKET, BY APPLICATION, 2018–2025 (THOUSAND SQUARE METER)
TABLE 86 MEA: PHENOLIC PANEL MARKET, BY APPLICATION, 2018–2025 (USD MILLION)
TABLE 87 MEA: PHENOLIC PANEL MARKET, BY CLASS, 2018–2025 (THOUSAND SQUARE METER)
TABLE 88 MEA: PHENOLIC PANEL MARKET, BY CLASS, 2018–2025 (USD MILLION)
TABLE 89 MEA: PHENOLIC PANEL MARKET, BY TYPE, 2018–2025 (THOUSAND SQUARE METER)
TABLE 90 MEA: PHENOLIC PANEL MARKET, BY TYPE, 2018–2025 (USD MILLION)
TABLE 91 MEA: PHENOLIC PANEL MARKET, BY COUNTRY, 2018–2025 (THOUSAND SQUARE METER)
TABLE 92 MEA: PHENOLIC PANEL MARKET, BY COUNTRY, 2018–2025 (USD MILLION)
TABLE 93 NEW PRODUCT DEVELOPMENTS, 2016–2019
TABLE 94 EXPANSIONS, 2016–2019
TABLE 95 ACQUISITIONS, 2016–2019
LIST OF FIGURES (41 Figures)
FIGURE 1 PHENOLIC PANEL MARKET: RESEARCH METHODOLOGY
FIGURE 2 MARKET SIZE ESTIMATION METHODOLOGY: SUPPLY-SIDE APPROACH
FIGURE 3 MARKET SIZE ESTIMATION METHODOLOGY: DEMAND-SIDE APPROACH
FIGURE 4 PHENOLIC PANEL MARKET: DATA TRIANGULATION
FIGURE 5 SANDWICH TYPE WAS THE LARGER SEGMENT IN 2019
FIGURE 6 CLASS A FORM ACCOUNTED FOR THE LARGEST MARKET SHARE IN 2019
FIGURE 7 INTERIOR APPLICATION SEGMENT ACCOUNTED FOR THE LARGEST SHARE OF THE MARKET IN 2019
FIGURE 8 CONSTRUCTION END-USE INDUSTRY ACCOUNTED FOR THE LARGEST SHARE OF THE MARKET IN 2019
FIGURE 9 NORTH AMERICA TO BE THE FASTEST-GROWING PHENOLIC PANEL MARKET
FIGURE 10 HIGH DEMAND FROM THE CONSTRUCTION INDUSTRY TO DRIVE THE MARKET BETWEEN 2020 AND 2025
FIGURE 11 EUROPE AND INTERIOR SEGMENT ACCOUNTED FOR THE LARGEST SHARES
FIGURE 12 CONSTRUCTION SEGMENT TO REGISTER THE HIGHEST CAGR
FIGURE 13 SANDWICH SEGMENT TO REGISTER HIGHER CAGR
FIGURE 14 CLASS A SEGMENT HOLDS THE LARGEST MARKET SHARE
FIGURE 15 CHINA TO REGISTER THE HIGHEST CAGR
FIGURE 16 DRIVERS, RESTRAINTS, OPPORTUNITIES, AND CHALLENGES IN THE PHENOLIC PANEL MARKET
FIGURE 17 PORTER’S FIVE FORCES: INTENSITY OF RIVALRY IS HIGH DUE TO THE PRESENCE OF MULTIPLE PLAYERS
FIGURE 18 CLASS A TO BE THE FASTEST-GROWING SEGMENT IN THE PHENOLIC PANEL MARKET
FIGURE 19 SANDWICH TYPE HOLDS THE LARGER MARKET SHARE IN THE PHENOLIC PANEL MARKET
FIGURE 20 NORTH AMERICA TO BE THE FASTEST-GROWING MARKET IN THE SANDWICH TYPE SEGMENT
FIGURE 21 CONSTRUCTION TO BE THE MAJOR MARKET FOR PHENOLIC PANELS
FIGURE 22 EUROPE TO BE THE LARGEST PHENOLIC PANEL MARKET IN THE CONSTRUCTION INDUSTRY
FIGURE 23 INTERIOR TO BE THE LARGEST APPLICATION OF PHENOLIC PANELS
FIGURE 24 EUROPE TO BE THE LARGEST PHENOLIC PANEL MARKET
FIGURE 25 UK TO BE FASTEST-GROWING MARKET FOR PHENOLIC PANEL BETWEEN 2020 AND 2025
FIGURE 26 NORTH AMERICA: PHENOLIC PANEL MARKET SNAPSHOT
FIGURE 27 EUROPE: PHENOLIC PANEL MARKET SNAPSHOT
FIGURE 28 APAC: PHENOLIC PANEL MARKET SNAPSHOT
FIGURE 29 SOUTH AMERICA: PHENOLIC PANEL MARKET SIZE
FIGURE 30 MEA: PHENOLIC PANEL MARKET SIZE, BY COUNTRY, 2020-2025
FIGURE 31 COMPANIES ADOPTED ACQUISITION AS THE KEY GROWTH STRATEGY BETWEEN 2016 AND 2019
FIGURE 32 PHENOLIC PANEL MARKET: COMPETITIVE LEADERSHIP MAPPING, 2019
FIGURE 33 PRODUCT PORTFOLIO ANALYSIS OF TOP PLAYERS IN PHENOLIC PANEL MARKET
FIGURE 34 BUSINESS STRATEGY EXCELLENCE OF TOP PLAYERS IN PHENOLIC PANEL MARKET
FIGURE 35 KINGSPAN GROUP: COMPANY SNAPSHOT
FIGURE 36 KINGSPAN GROUP: SWOT ANALYSIS
FIGURE 37 BROADVIEW HOLDING B.V.: SWOT ANALYSIS
FIGURE 38 FIBERESIN INDUSTRIES, INC.: SWOT ANALYSIS
FIGURE 39 WILSONART LLC: SWOT ANALYSIS
FIGURE 40 ASAHI KASEI CORPORATION: COMPANY SNAPSHOT
FIGURE 41 ASAHI KASEI CORPORATION: SWOT ANALYSIS
The study involves two major activities in estimating the current size of the phenolic panel market, i.e., primary and secondary research. Exhaustive secondary research was done to collect information on the market, the peer market, and the parent market. The next step was to validate these findings, assumptions, and sizing with industry experts across the value chain through primary research. Both top-down and bottom-up approaches were employed to estimate the total market size. After that, market breakdown and data triangulation procedures were used to determine the extent of market segments and sub-segments.
Secondary Research
In the secondary research process, various secondary sources, such as Hoovers, Bloomberg BusinessWeek, and Factiva, were referred to, to identify and collect information for this study. These secondary sources included annual reports, press releases & investor presentations of companies, white papers, certified publications, articles by recognized authors, gold standard & silver standard websites, regulatory bodies, trade directories, and databases.
Primary Research
The phenolic panel market comprises several stakeholders, such as raw material suppliers, processors, end-product manufacturers, and regulatory organizations in the supply chain. The demand side of this market is characterized by the development of the construction, aerospace & defense, marine, and transportation industries. Advancements in technology and diverse applications in various end-use industries describe the supply side. Various primary sources from both the supply and demand sides of the market were interviewed to obtain qualitative and quantitative information.
Following is the breakdown of primary respondents:
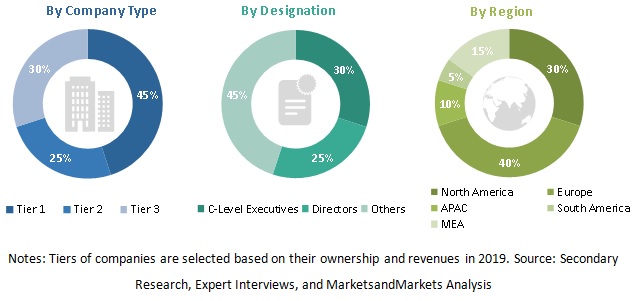
To know about the assumptions considered for the study, download the pdf brochure
Market Size Estimation
Both the top-down and bottom-up approaches were used to estimate and validate the total phenolic panel market. These methods were also used extensively to determine the size of various sub-segments in the market. The research methodology used to estimate the market size included the following:
- The key players in the industry and market were identified through extensive secondary research.
- The industry’s supply chain and market size in terms of value were determined through primary and secondary research processes.
- All percentage shares, splits, and breakdowns were determined using secondary sources and verified through primary sources.
Data Triangulation
After arriving at the overall phenolic panel market size using the market size estimation processes as explained above, the market was split into several segments and sub-segments. To complete the whole market engineering process and arrive at the exact statistics of each market segment and subsegment, the data triangulation, and market breakdown procedures were employed, wherever applicable. The data was triangulated by studying various factors and trends from both the demand and supply sides, mainly from the mining & quarrying, cement & aggregate, and steel end-use industries.
Report Objectives
- To define, describe, and forecast the market size of the phenolic panel market in terms of value and volume
- To provide detailed information about the key factors (drivers, restraints, opportunities, and challenges) influencing the growth of the market
- To analyze and forecast the market based on type, class, application and end-use industry
- To analyze and forecast the market based on five regions, namely, Europe, North America, APAC, the MEA, and South America
- To strategically analyze micro markets concerning individual growth trends, prospects, and their contribution to the overall market
- To analyze the opportunities in the market for stakeholders and provide a competitive landscape for market leaders
- To strategically profile the key players and comprehensively analyze their market share and core competencies
Available Customizations
With the given market data, MarketsandMarkets offers customizations according to the company’s specific needs.
The following customization options are available for the report:
Product Analysis
- Product matrix, which gives a detailed comparison of the product portfolio of each company
Regional Analysis
- Further breakdown of Rest of APAC phenolic panel market
- Further breakdown of Rest of European phenolic panel market
- Further breakdown of Rest of MEA phenolic panel market
- Further breakdown of Rest of Latin American phenolic panel market
Company Information
- Detailed analysis and profiling of additional market players (up to 10)


Growth opportunities and latent adjacency in Phenolic Panel Market