Battery Separators Market

Battery Separators Market by Battery Type (Lead Acid and Li-ion), Material (Polyethylene and Polypropylene), Technology (Dry and Wet), End-Use (Automotive, Consumer Electronics, Industrial), and Region - Global Forecast to 2028

Report Code: CH 5958 Jan, 2024, by marketsandmarkets.com

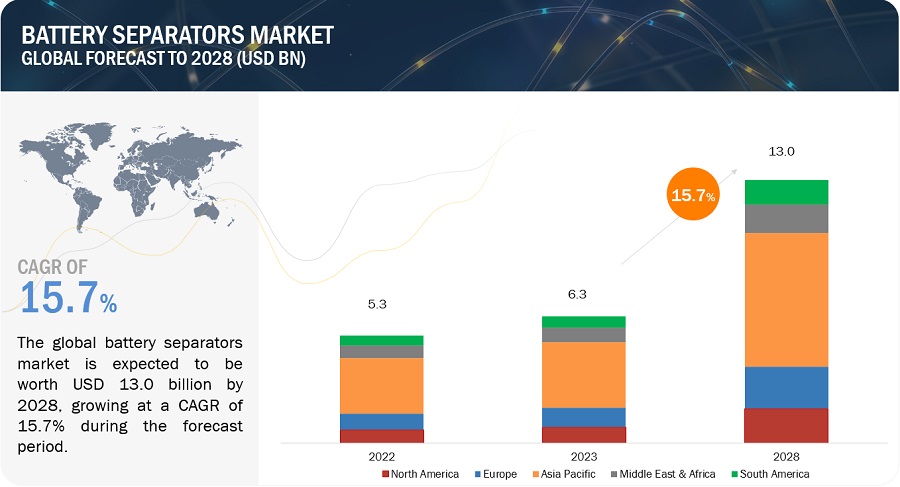
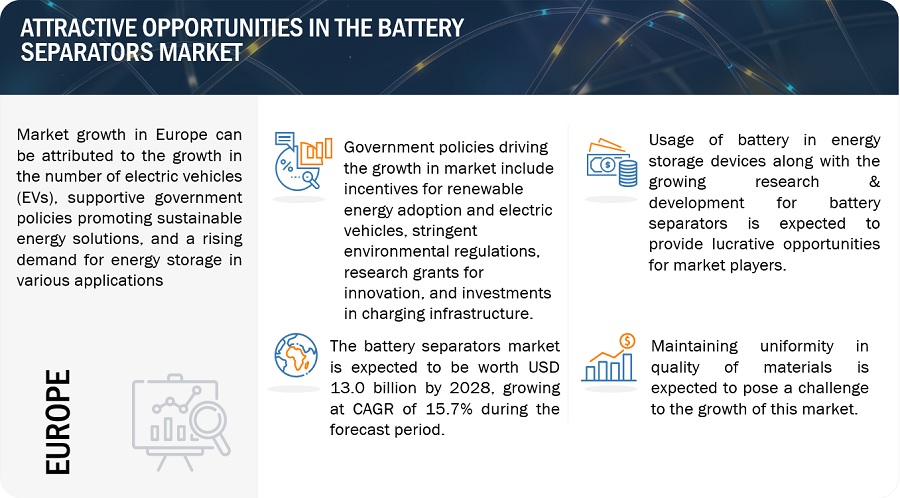
The global battery separators market is projected to grow from USD 6.3 billion in 2023 to USD 13.0  billion by 2028, at a CAGR of 15.7% during the forecast period. Industrial, automotive, and consumer electronics sectors are driving the growth in battery separators market. In industrial applications, they ensure reliable energy storage for uninterrupted operations and facilitate the integration of renewable energy sources. The automotive sector benefits from high-performance separators in electric and hybrid vehicles, enhancing battery efficiency and safety. In consumer electronics, battery separators enable the development of compact, powerful devices, supporting the rise of smartphones, tablets, and wearable technology.

Attractive Opportunities in the Battery Separators Market
Battery Separators Market

To know about the assumptions considered for the study, Request for Free Sample Report
Battery Separators Market

Market Dynamics:

Driver: Increasing adoption of lithium-ion batteries in the renewable sector

Deep-cycle lithium-ion and lead-acid batteries emerge as crucial storage options for renewable energy. Despite the fact that lithium batteries are moderately new to this area, they are tending to a portion of the restrictions related with lead-acid other options. Moreover, lithium batteries are replacing lead-acid batteries in different applications, including private, business, and sporting vehicle use. As additional enterprises perceive the advantages of changing to sustainable power, there is an high focus on creating further developed batteries. The developing electric vehicle market, with its emphasis on more secure, lighter, and more productive batteries, is one of the huge driver for battery separators market. Also, the flood in sustainable power, driven by progressions in lithium batteries, grows opportunities for energy capacity, helping both the climate and the economy and one more key driver for the battery separators market is the developing interest for energy capacity arrangements in the telecom area. As worldwide network increments and the dependence on cell phones strengthens, there's an elevated requirement for solid and enduring batteries in telecom foundation. The battery separators market is likely to be significantly influenced by the growing preference for lithium-ion batteries in the mentioned earlier and other industries.

Restraints: Proper storage and transportation of batteries

Dealing with batteries of all types involves inherent risks. Without appropriate safeguards, batteries can present dangers to local people, whether they are being used, charging, or just put away. The potential issues incorporate overheating, consuming, or exploding battery chargers which prompts electrical shock and burns. These battery-related dangers can bring about accidents, deaths, and property loss. For example, misusing of lithium-ion batteries leads to numerous work-related injuries. Beyond lithium-ion batteries, even commonly used lead-acid batteries and standard 9-volt dry cell batteries from supermarkets can pose serious risks to those nearby. Hence, the absence of appropriate storage and transportation of batteries is driving legislatures to make a severe move against producers of these batteries, which will hamper the development of the battery separators market.

Opportunity: Battery usage in energy storage devices

A rapidly extending innovation in the sustainable energy area is battery energy capacity frameworks, perceived as effective means to reduce dependence on fossil fuels and address power fluctuation. Lithium-ion batteries are one of the significant battery types used in energy storage devices. Furthermore, lead-acid batteries are a great decision for a battery energy storage since they are a more reasonable battery choice and are recyclable. They are additionally more secure than a few different chemistries because their active components are not flammable. These batteries are intended for widespread performance with high power yield in different applications, for example, data center and others. As data centers use lead-acid batteries, their demand is expected to increase, and this further gives an opportunity to the development of the battery separators market.

Challenge: Lack of government support and infrastructure in emerging economies

The adoption of sustainable energy sources, various countries' governments are prioritizing the provision of subsidies and incentives to support the manufacturing of lithium-ion batteries. In certain nations, governments offer exemptions and incentives to encourage the development of grid-connected power storage facilities and the adoption of electric vehicles. To adopt the electric vehicles, a few countries have executed strategies including exclusions from or refunds on road tolls. However, supportive capital markets, battery research promotion, early-stage product facilitation, and scaling up electric vehicle manufacturing are all necessary for emerging markets. To meet current and future energy capacity requirements, India's thriving lead-acid battery manufacturing sector needs to be expanded. Support for Research and development is expected to reduce initial investment costs, and involve small and medium-sized enterprises (SMEs) in the production of industrial units for the ecosystem that manufactures rechargeable battery cells. Therefore, the absence of government support and infrastructure in developing economies is anticipated to pose a challenge to the expansion of the battery separators market.

Battery Separators Market: Ecosystem

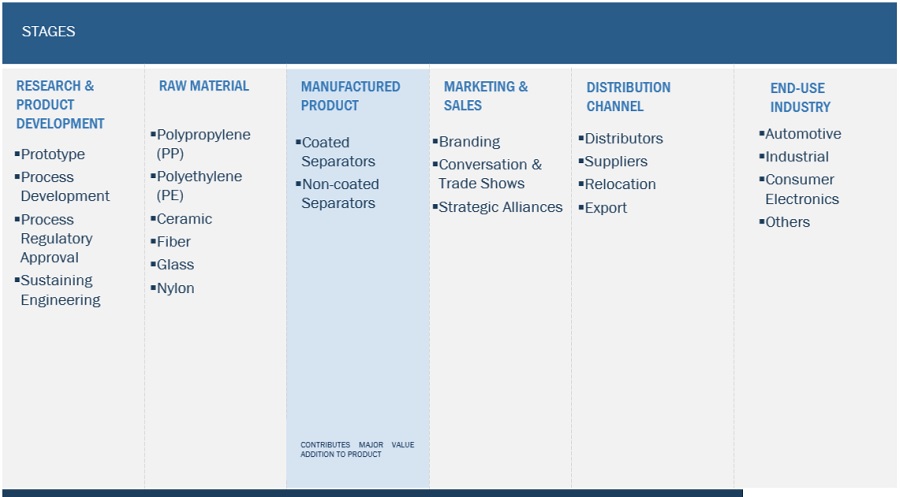
Prominent companies in this market include well-established, and financially stable manufacturers of battery separators market. These companies have been operating in the market for several years and possess a diversified product portfolio and strong global sales and marketing networks. Prominent companies in this market include Asahi Kasei Corporation (Japan), ENTEK (US), Shanghai Energy New Materials Technology Co., Ltd. (China), SK ie technology (South Korea), Toray Industries, Inc. (Japan), and UBE Corporation (Japan).
Battery Separators Market Ecosystem

"Polypropylene segment, by material, is estimated to account for the highest CAGR during the forecast period."

Polypropylene (PP) is one of the most adaptable polymers accessible and can be utilized as fiber and plastic in various industries, including automotive and medical devices. Specifically, polypropylene separators find widespread use in the batteries of electric vehicles (EVs) to enhance battery performance and safety. These separators are designed to withstand high temperatures and provide excellent chemical stability, making them ideal for use in lithium-ion batteries. As the demand for electric vehicles continues to grow, the use of polypropylene in battery separators is expected to increase, contributing to the development of advanced and reliable energy storage systems. The interest for polypropylene is expected to rise further because of expanding needs in auto parts, design attire, medical services gadgets, and different areas.

"Others segment, by battery type, is estimated to account for the highest CAGR during the forecast period."

The battery industry is growing rapidly, and the demand for cost-effective and high-quality battery materials is increasing. Different types of batteries, such as nickel-metal hydride, nickel cadmium, and antacid frameworks. Basic batteries are utilized in an extensive variety of family things, like compact Disc players, controllers, lights, computerized cameras, and others. The battery separator market is driven by the overall growth in the battery industry and the rising demand for energy storage solutions, particularly in consumer electronics and household appliances. The general development in the battery business, combined with a rising interest for cost effective and great battery materials, fills in as the essential driver powering the interest for battery separators market.

"Automotive segment, by end-use, is estimated to account for the highest CAGR during the forecast period."

The demand for battery-driven vehicles, such as hybrid electric vehicles and plug-in hybrid electric vehicles, is primarily driven by the automotive end-use sector. Automotive is the largest end-use sector for battery separators market. Additionally, there are various advancements in automotive lead-acid batteries to meet the growing electrical demands of modern vehicles and the rising demand for efficiency. Moreover, continuous advancements in automotive lead-acid batteries are directed towards fulfilling the increasing electrical needs of modern vehicles and improving efficiency. These headways add to the expanded use of batteries in the auto area. Thus, the rising interest for batteries inside the automotive sector. As a result, the increasing demand for batteries in the automotive industry is anticipated to simultaneously boost the market demand for battery separators.

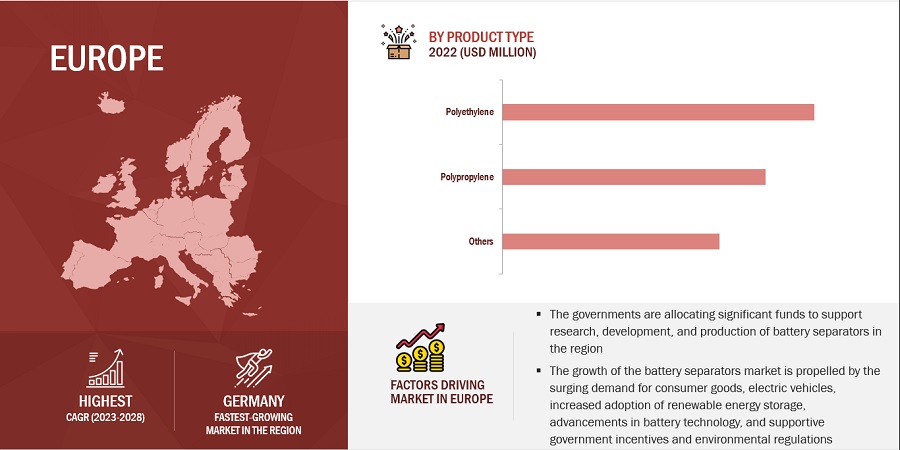
"Europe region is estimated to account for the highest CAGR during the forecast period."

The demand for batteries in Europe is significant, driven by their essential applications as sustainable, clean, and compact sources of power in consumer electronics and automotive. In, the automotive industry, there is a growing emphasis on electric vehicles, and the adoption of batteries for sustainable and efficient power solutions is on the rise and the consumer electronics market in Europe is witnessing notable growth, especially in the segment of wearable devices. The combined demand from both the automotive and consumer electronics sectors, along with the battery manufacturers, positions Europe as a region experience the highest CAGR in the battery separators market during the forecast period.
Battery Separators Market by Region

To know about the assumptions considered for the study, download the pdf brochure

Source: Secondary Research, Expert Interviews, and MarketsandMarkets Analysis

Key Market Players

Major companies in the battery separators market include Asahi Kasei Corporation (Japan), ENTEK (US), Shanghai Energy New Materials Technology Co., Ltd. (China), SK ie technology (South Korea), Toray Industries, Inc. (Japan), and UBE Corporation (Japan) among others. A total of 26 major players have been covered. These players have adopted product launches, agreements, joint ventures, investments, acquisitions, mergers, and expansions as the major strategies to consolidate their position in the market.

Get online access to the report on the World's First Market Intelligence Cloud

  • Easy to Download Historical Data & Forecast Numbers
  • Company Analysis Dashboard for high growth potential opportunities
  • Research Analyst Access for customization & queries
  • Competitor Analysis with Interactive dashboard
  • Latest News, Updates & Trend analysis
Request Sample

Scope of the Report

Report Metric

Details

Market Size Available for Years

2018–2028

Base Year Considered

2022

Forecast Period

2023–2028

Forecast Units

Value (USD Billion) and Volume (Million Square Meters)

Segments Covered

Type, Material, Thickness, Technology, Battery Type, End-use, and Region

Geographies Covered

Asia Pacific, Europe, North America, the Middle East & Africa, and South America

Companies Covered

The major market players include Asahi Kasei Corporation (Japan), Shanghai Energy New Materials Technology Co., Ltd. (China), SK ie technology (South Korea), Toray Industries, Inc. (Japan), Ahlstrom (Finland), Sinoma Science & Technology Co., Ltd. (China), Bernard Dumas (France), Cangzhou Mingzhu Plastic Co., Ltd. (China), Delfortgroup AG (Asutria), Eaton (Europe), ENTEK (US), Freudenberg (Germany), Hebei Gellec New Energy Science & Technology Co., Ltd. (China), Mitsubishi Paper Mills Limited (Japan), Hollingsworth & Vose (US), Nanografi Nano Technology (Turkey), Solvay (Belgium), Sumitomo Chemical Co., Ltd. (Japan), Teijin Limited (Japan), UBE Corporation (Japan), W-Scope Corporation (Japan), and others.

This research report categorizes the battery separators market based on Type, Material, Thickness, Technology, Battery Type, End-use, and Region.

Based on Type, the battery separators market has been segmented as follows:
  • Coated Separators
  • Non-coated Separators
Based on Material, the battery separators market has been segmented as follows:
  • Polypropylene
  • Polyethylene
  • Others
Based on Thickness, the battery separators market has been segmented as follows:
  • 5µM–10µm
  • 10µM–20µM
Based on Technology, the battery separators market has been segmented as follows:
  • Dry Battery Separator
  • Wet Battery Separator
Based on Battery Type, the battery separators market has been segmented as follows:
  • Lithium-ion (Li-ion)
  • Lead-acid
  • Others
Based on End-use, the battery separators market has been segmented as follows:
  • Automotive
  • Consumer Electronics
  • Industrial
  • Others
Based on region, the battery separators market has been segmented as follows:
  • Asia Pacific
  • Europe
  • North America
  • Middle East & Africa
  • South America

Recent Developments

  • In October 2023, Asahi Kasei is set to expand its coating capacity for lithium-ion battery (LIB) separators, with the aim of meeting the increasing demand for electric vehicles, particularly in North America. The expansion will raise the company's coating capacity to approximately 1.2 billion m2/year, enabling the supply of coated separators for batteries equivalent to 1.7 million electric vehicles. This investment is part of Asahi Kasei's strategy to strengthen its LIB separator supply infrastructure for automotive applications and to support the significant growth in electric vehicle production, especially in North America. The expansion will involve the installation of new coating lines at existing Asahi Kasei facilities in the US, Japan, and South Korea, with the start-up scheduled in succession from the first half of fiscal year 2026.
  • In December 2023, Solvay has finalized an agreement with the U.S. Department of Energy grant to build a facility in Augusta, GA, to manufacture battery-grade PVDF, which is used as a lithium-ion binder and separator coating in electric vehicle batteries. The facility, expected to be operational in 2026. This agreement will significantly strengthen Solvay's position in the battery separator market.
  • In January 2022, ENTEK acquired AEF, a leading provider of material handling systems. Building both extrusion and material handling equipment, ENTEK expanded its manufacturing capabilities in its recently completed facility in Henderson, NV, offering the required space and resources to support the expansion of the merged businesses.

Frequently Asked Questions (FAQ):

To speak to our analyst for a discussion on the above findings, click Speak to Analyst

TABLE OF CONTENTS
 
1 INTRODUCTION (Page No. - 33)
    1.1 STUDY OBJECTIVES 
    1.2 MARKET DEFINITION 
           1.2.1 INCLUSIONS AND EXCLUSIONS
                    TABLE 1 BATTERY SEPARATORS MARKET: INCLUSIONS AND EXCLUSIONS
    1.3 MARKET SCOPE 
          FIGURE 1 BATTERY SEPARATORS MARKET SEGMENTATION
           1.3.1 REGIONS COVERED
           1.3.2 YEARS CONSIDERED
    1.4 CURRENCY CONSIDERED 
    1.5 UNITS CONSIDERED 
    1.6 LIMITATIONS 
    1.7 STAKEHOLDERS 
    1.8 SUMMARY OF CHANGES 
 
2 RESEARCH METHODOLOGY (Page No. - 38)
    2.1 RESEARCH DATA 
          FIGURE 2 BATTERY SEPARATORS MARKET: RESEARCH DESIGN
           2.1.1 SECONDARY DATA
                    2.1.1.1 Key data from secondary sources
           2.1.2 PRIMARY DATA
                    2.1.2.1 Key data from primary sources
                    2.1.2.2 Participating companies for primary research
                    2.1.2.3 Breakdown of primary interviews
    2.2 MATRIX CONSIDERED FOR DEMAND-SIDE ANALYSIS 
          FIGURE 3 MATRIX CONSIDERED FOR ESTIMATING DEMAND OF BATTERY SEPARATORS
    2.3 MARKET SIZE ESTIMATION 
           2.3.1 BOTTOM-UP APPROACH
                    FIGURE 4 MARKET SIZE ESTIMATION: BOTTOM-UP APPROACH
           2.3.2 TOP-DOWN APPROACH
                    FIGURE 5 MARKET SIZE ESTIMATION: TOP-DOWN APPROACH
    2.4 SUPPLY-SIDE SIZING OF BATTERY SEPARATORS MARKET: METHODOLOGY 1 
    2.5 SUPPLY-SIDE SIZING OF BATTERY SEPARATORS MARKET: METHODOLOGY 2 
           2.5.1 CALCULATIONS FOR SUPPLY-SIDE ANALYSIS
           2.5.2 MARKET FORECAST
           2.5.3 GROWTH RATE ASSUMPTIONS/GROWTH FORECAST
    2.6 DATA TRIANGULATION 
          FIGURE 6 BATTERY SEPARATORS MARKET: DATA TRIANGULATION
    2.7 RESEARCH ASSUMPTIONS 
    2.8 RESEARCH LIMITATIONS 
    2.9 IMPACT OF RECESSION 
    2.10 RISK ANALYSIS 
 
3 EXECUTIVE SUMMARY (Page No. - 47)
    TABLE 2 BATTERY SEPARATORS MARKET SNAPSHOT: 2023 VS. 2028
    FIGURE 7 POLYETHYLENE SEGMENT TO ACCOUNT FOR LARGEST MARKET SHARE DURING FORECAST PERIOD
    FIGURE 8 LI-ION BATTERY SEGMENT TO WITNESS HIGHEST GROWTH DURING FORECAST PERIOD
    FIGURE 9 AUTOMOTIVE SEGMENT TO DOMINATE BATTERY SEPARATORS MARKET BETWEEN 2023 AND 2028
    FIGURE 10 ASIA PACIFIC TO DOMINATE MARKET DURING FORECAST PERIOD
 
4 PREMIUM INSIGHTS (Page No. - 51)
    4.1 SIGNIFICANT OPPORTUNITIES FOR PLAYERS IN BATTERY SEPARATORS MARKET 
          FIGURE 11 BATTERY SEPARATORS MARKET TO WITNESS SIGNIFICANT GROWTH BETWEEN 2023 AND 2028
    4.2 ASIA PACIFIC BATTERY SEPARATORS MARKET, BY BATTERY TYPE AND COUNTRY 
          FIGURE 12 CHINA ACCOUNTED FOR LARGEST MARKET SHARE IN ASIA PACIFIC
    4.3 BATTERY SEPARATORS MARKET, BY TECHNOLOGY 
          FIGURE 13 DRY BATTERY SEPARATOR SEGMENT TO ACCOUNT FOR LARGER SHARE DURING FORECAST PERIOD
    4.4 BATTERY SEPARATORS MARKET, BY MAJOR COUNTRIES 
          FIGURE 14 GERMANY TO GROW AT HIGHEST RATE DURING FORECAST PERIOD
 
5 MARKET OVERVIEW (Page No. - 53)
    5.1 INTRODUCTION 
    5.2 MARKET DYNAMICS 
          FIGURE 15 DRIVERS, RESTRAINTS, OPPORTUNITIES, AND CHALLENGES IN BATTERY SEPARATORS MARKET
           5.2.1 DRIVERS
                    5.2.1.1 Increasing adoption of lithium-ion batteries in renewable energy sector
                    5.2.1.2 High growth of EVs and plug-in vehicles sector
                                TABLE 3 ANNOUNCEMENTS RELATED TO ELECTRIC LIGHT-DUTY VEHICLES (PHEVS AND BEVS)
                                FIGURE 16 GLOBAL SALES AND FORECAST OF BATTERY ELECTRIC VEHICLES AND PLUG-IN HYBRID ELECTRIC VEHICLES, 2021–2027
                    5.2.1.3 Surge in demand for consumer electronics
           5.2.2 RESTRAINTS
                    5.2.2.1 Safety concerns related to lead-acid and lithium-ion batteries
                    5.2.2.2 Lack of government support and infrastructure in emerging economies
           5.2.3 OPPORTUNITIES
                    5.2.3.1 Increasing demand for energy storage devices
                    5.2.3.2 Growing R&D for battery separators
           5.2.4 CHALLENGES
                    5.2.4.1 Maintaining uniformity in quality of materials
    5.3 PORTER'S FIVE FORCES ANALYSIS 
          FIGURE 17 BATTERY SEPARATORS MARKET: PORTER'S FIVE FORCES ANALYSIS
          TABLE 4 BATTERY SEPARATORS MARKET: PORTER'S FIVE FORCES ANALYSIS
           5.3.1 BARGAINING POWER OF SUPPLIERS
           5.3.2 THREAT OF NEW ENTRANTS
           5.3.3 THREAT OF SUBSTITUTES
           5.3.4 BARGAINING POWER OF BUYERS
           5.3.5 INTENSITY OF COMPETITIVE RIVALRY
    5.4 TARIFF AND REGULATORY LANDSCAPE 
           5.4.1 REGULATIONS AND STANDARDS FOR BATTERIES
                    TABLE 5 GENERAL REQUIREMENTS FOR SEPARATORS USED IN LI-ION BATTERIES
           5.4.2 UL SUBJECT 2591
           5.4.3 REGULATORY BODIES, GOVERNMENT AGENCIES, AND OTHER ORGANIZATIONS
                    TABLE 6 NORTH AMERICA: REGULATORY BODIES, GOVERNMENT AGENCIES, AND OTHER ORGANIZATIONS
                    TABLE 7 EUROPE: REGULATORY BODIES, GOVERNMENT AGENCIES, AND OTHER ORGANIZATIONS
                    TABLE 8 ASIA PACIFIC: REGULATORY BODIES, GOVERNMENT AGENCIES, AND OTHER ORGANIZATIONS
                    TABLE 9 REST OF THE WORLD: REGULATORY BODIES, GOVERNMENT AGENCIES, AND OTHER ORGANIZATIONS
    5.5 SUPPLY CHAIN ANALYSIS 
          FIGURE 18 SUPPLY CHAIN ANALYSIS: BATTERY SEPARATORS MARKET
           5.5.1 RAW MATERIALS
           5.5.2 MANUFACTURING OF BATTERY SEPARATORS
           5.5.3 DISTRIBUTION TO END USERS
    5.6 ECOSYSTEM ANALYSIS 
          FIGURE 19 BATTERY SEPARATORS MARKET: ECOSYSTEM MAPPING
          TABLE 10 BATTERY SEPARATORS MARKET: ROLE IN ECOSYSTEM
    5.7 CASE STUDY ANALYSIS 
           5.7.1 USE OF NON-POROUS SEPARATOR TO ENHANCE SAFETY OF LITHIUM METAL ANODE BATTERIES
                    5.7.1.1 Problem statement
                    5.7.1.2 Solutions offered
                    5.7.1.3 Outcome
    5.8 TECHNOLOGY ANALYSIS 
    5.9 KEY STAKEHOLDERS AND BUYING CRITERIA 
           5.9.1 KEY STAKEHOLDERS IN BUYING PROCESS
                    FIGURE 20 INFLUENCE OF STAKEHOLDERS ON BUYING PROCESS FOR TOP THREE END-USE INDUSTRIES
                    TABLE 11 INFLUENCE OF STAKEHOLDERS ON BUYING PROCESS FOR TOP THREE END-USE INDUSTRIES (%)
           5.9.2 BUYING CRITERIA
                    FIGURE 21 KEY BUYING CRITERIA FOR TOP THREE END-USE INDUSTRIES
                    TABLE 12 KEY BUYING CRITERIA FOR TOP THREE END-USE INDUSTRIES
    5.10 KEY CONFERENCES AND EVENTS (2024) 
           TABLE 13 BATTERY SEPARATORS MARKET: KEY CONFERENCES AND EVENTS (2024)
    5.11 PRICING ANALYSIS 
           5.11.1 AVERAGE SELLING PRICE OF BATTERY SEPARATORS, BY MATERIAL
                     FIGURE 22 AVERAGE SELLING PRICE, BY MATERIAL
           5.11.2 AVERAGE SELLING PRICE OF BATTERY SEPARATORS, BY REGION
                     FIGURE 23 AVERAGE SELLING PRICE, BY REGION
    5.12 TRADE DATA 
           5.12.1 IMPORT SCENARIO
                     TABLE 14 IMPORT DATA ON LITHIUM CELLS AND BATTERIES
           5.12.2 EXPORT SCENARIO
                     TABLE 15 EXPORT DATA ON LITHIUM CELLS AND BATTERIES
    5.13 TRENDS/DISRUPTIONS IMPACTING CUSTOMER'S BUSINESSES 
           FIGURE 24 TRENDS AND DISRUPTIONS IMPACTING CUSTOMERS' BUSINESSES
    5.14 PATENT ANALYSIS 
           5.14.1 METHODOLOGY
                     FIGURE 25 LIST OF MAJOR PATENTS FOR BATTERY SEPARATOR
           5.14.2 MAJOR PATENTS
 
6 BATTERY SEPARATORS MARKET, BY TYPE (Page No. - 75)
    6.1 INTRODUCTION 
    6.2 COATED SEPARATOR 
           6.2.1 DEMAND FOR COATED SEPARATORS INCREASING TO ENHANCE PERFORMANCE AND SAFETY
    6.3 NON-COATED SEPARATOR 
           6.3.1 GROWTH IN ENERGY STORAGE SYSTEMS TO DRIVE DEMAND FOR NON-COATED SEPARATORS
 
7 BATTERY SEPARATORS MARKET, BY THICKNESS (Page No. - 76)
    7.1 INTRODUCTION 
    7.2 5µM–10µM 
           7.2.1 USAGE IN PRIMARY AND SECONDARY LITHIUM BATTERIES TO POWER PORTABLE ELECTRONIC DEVICES TO PROPEL DEMAND
    7.3 10µM–20µM 
           7.3.1 GOOD MECHANICAL PROPERTIES AND CHEMICAL STABILITY TO INCREASE CONSUMPTION
 
8 BATTERY SEPARATORS MARKET, BY BATTERY TYPE (Page No. - 77)
    8.1 INTRODUCTION 
          FIGURE 26 LEAD-ACID BATTERY SEGMENT TO ACCOUNT FOR LARGEST MARKET SHARE DURING FORECAST PERIOD
          TABLE 16 BATTERY SEPARATORS MARKET SIZE, BY BATTERY TYPE, 2018–2021 (USD MILLION)
          TABLE 17 BATTERY SEPARATORS MARKET SIZE, BY BATTERY TYPE, 2022–2028 (USD MILLION)
    8.2 LITHIUM-ION (LI-ION) 
           8.2.1 HIGH CAPACITY AND LIGHTWEIGHT PROPERTIES TO INCREASE DEMAND
                    TABLE 18 LITHIUM-ION: BATTERY SEPARATORS MARKET SIZE, BY REGION, 2018–2021 (USD MILLION)
                    TABLE 19 LITHIUM-ION: BATTERY SEPARATORS MARKET SIZE, BY REGION, 2022–2028 (USD MILLION)
    8.3 LEAD-ACID 
           8.3.1 LOW MATERIAL COSTS, SAFETY, AND RECYCLABILITY OF LEAD-ACID BATTERIES TO PROPEL DEMAND
                    TABLE 20 LEAD-ACID: BATTERY SEPARATORS MARKET SIZE, BY REGION, 2018–2021 (USD MILLION)
                    TABLE 21 LEAD-ACID: BATTERY SEPARATORS MARKET SIZE, BY REGION, 2022–2028 (USD MILLION)
    8.4 OTHER BATTERY TYPES 
          TABLE 22 OTHER BATTERY TYPES: BATTERY SEPARATORS MARKET SIZE, BY REGION, 2018–2021 (USD MILLION)
          TABLE 23 OTHER BATTERY TYPES: BATTERY SEPARATORS MARKET SIZE, BY REGION, 2022–2028 (USD MILLION)
 
9 BATTERY SEPARATORS MARKET, BY MATERIAL (Page No. - 82)
    9.1 INTRODUCTION 
          FIGURE 27 POLYETHYLENE SEGMENT TO ACCOUNT FOR LARGEST MARKET SHARE DURING FORECAST PERIOD
          TABLE 24 BATTERY SEPARATORS MARKET SIZE, BY MATERIAL, 2018–2021 (USD MILLION)
          TABLE 25 BATTERY SEPARATORS MARKET SIZE, BY MATERIAL, 2022–2028 (USD MILLION)
    9.2 POLYPROPYLENE 
           9.2.1 POLYPROPYLENE SEPARATORS WIDELY USED IN BATTERIES FOR EVS
                    TABLE 26 POLYPROPYLENE: BATTERY SEPARATORS MARKET SIZE, BY REGION, 2018–2021 (USD MILLION)
                    TABLE 27 POLYPROPYLENE: BATTERY SEPARATORS MARKET SIZE, BY REGION, 2022–2028 (USD MILLION)
    9.3 POLYETHYLENE 
           9.3.1 POLYETHYLENE SEPARATORS WIDELY USED IN CONSUMER ELECTRONICS AND HIGH-POWER APPLICATIONS
                    TABLE 28 POLYETHYLENE: BATTERY SEPARATORS MARKET SIZE, BY REGION, 2018–2021 (USD MILLION)
                    TABLE 29 POLYETHYLENE: BATTERY SEPARATORS MARKET SIZE, BY REGION, 2022–2028 (USD MILLION)
    9.4 OTHER MATERIALS 
          TABLE 30 OTHER MATERIALS: BATTERY SEPARATORS MARKET SIZE, BY REGION, 2018–2021 (USD MILLION)
          TABLE 31 OTHER MATERIALS: BATTERY SEPARATORS MARKET SIZE, BY REGION, 2022–2028 (USD MILLION)
 
10 BATTERY SEPARATORS MARKET, BY TECHNOLOGY (Page No. - 87)
     10.1 INTRODUCTION 
             FIGURE 28 DRY BATTERY SEPARATOR SEGMENT TO HOLD LARGER MARKET SHARE DURING FORECAST PERIOD
             TABLE 32 BATTERY SEPARATORS MARKET SIZE, BY TECHNOLOGY, 2018–2021 (MILLION SQUARE METERS)
             TABLE 33 BATTERY SEPARATORS MARKET SIZE, BY TECHNOLOGY, 2022–2028 (MILLION SQUARE METERS)
     10.2 DRY BATTERY SEPARATOR 
             10.2.1 DRY BATTERY SEPARATORS TO DOMINATE OVERALL MARKET DURING FORECAST PERIOD
     10.3 WET BATTERY SEPARATOR 
             10.3.1 WET SEPARATOR USED TO IMPROVE ENERGY DENSITY OF BATTERIES
 
11 BATTERY SEPARATORS MARKET, BY END-USE INDUSTRY (Page No. - 90)
     11.1 INTRODUCTION 
             FIGURE 29 AUTOMOTIVE TO BE FASTEST-GROWING END-USE INDUSTRY FOR BATTERY SEPARATORS
             TABLE 34 BATTERY SEPARATORS MARKET SIZE, BY END-USE INDUSTRY, 2018–2021 (USD MILLION)
             TABLE 35 BATTERY SEPARATORS MARKET SIZE, BY END-USE INDUSTRY, 2022–2028 (USD MILLION)
     11.2 AUTOMOTIVE 
             11.2.1 AUTOMOTIVE SECTOR TO BE LARGEST END USER OF BATTERY SEPARATORS
                        TABLE 36 AUTOMOTIVE: BATTERY SEPARATORS MARKET SIZE, BY REGION, 2018–2021 (USD MILLION)
                        TABLE 37 AUTOMOTIVE: BATTERY SEPARATORS MARKET SIZE, BY REGION, 2022–2028 (USD MILLION)
     11.3 CONSUMER ELECTRONICS 
             11.3.1 DEMAND FOR LITHIUM-ION BATTERY SEPARATORS INCREASING IN CONSUMER ELECTRONICS SEGMENT
                        TABLE 38 CONSUMER ELECTRONICS: BATTERY SEPARATORS MARKET SIZE, BY REGION, 2018–2021 (USD MILLION)
                        TABLE 39 CONSUMER ELECTRONICS: BATTERY SEPARATORS MARKET SIZE, BY REGION, 2022–2028 (USD MILLION)
     11.4 INDUSTRIAL 
             11.4.1 GROWTH IN DEMAND FOR CONSTRUCTION AND MINING EQUIPMENT TO SUPPORT MARKET FOR BATTERY SEPARATORS
                        TABLE 40 INDUSTRIAL: BATTERY SEPARATORS MARKET SIZE, BY REGION, 2018–2021 (USD MILLION)
                        TABLE 41 INDUSTRIAL: BATTERY SEPARATORS MARKET SIZE, BY REGION, 2022–2028 (USD MILLION)
     11.5 OTHER END-USE INDUSTRIES 
             TABLE 42 OTHER END-USE INDUSTRIES: BATTERY SEPARATORS MARKET SIZE, BY REGION, 2018–2021 (USD MILLION)
             TABLE 43 OTHER END-USE INDUSTRIES: BATTERY SEPARATORS MARKET SIZE, BY REGION, 2022–2028 (USD MILLION)
 
12 BATTERY SEPARATORS MARKET, BY REGION (Page No. - 96)
     12.1 INTRODUCTION 
             FIGURE 30 ASIA PACIFIC TO ACCOUNT FOR LARGEST MARKET SHARE DURING FORECAST PERIOD
             TABLE 44 BATTERY SEPARATORS MARKET SIZE, BY REGION, 2018–2021 (USD MILLION)
             TABLE 45 BATTERY SEPARATORS MARKET SIZE, BY REGION, 2022–2028 (USD MILLION)
     12.2 ASIA PACIFIC 
             12.2.1 IMPACT OF RECESSION
                        FIGURE 31 ASIA PACIFIC: BATTERY SEPARATORS MARKET SNAPSHOT
                        TABLE 46 ASIA PACIFIC: BATTERY SEPARATORS MARKET SIZE, BY BATTERY TYPE, 2018–2021 (USD MILLION)
                        TABLE 47 ASIA PACIFIC: BATTERY SEPARATORS MARKET SIZE, BY BATTERY TYPE, 2022–2028 (USD MILLION)
                        TABLE 48 ASIA PACIFIC: BATTERY SEPARATORS MARKET SIZE, BY END-USE INDUSTRY, 2018–2021 (USD MILLION)
                        TABLE 49 ASIA PACIFIC: BATTERY SEPARATORS MARKET SIZE, BY END-USE INDUSTRY, 2022–2028 (USD MILLION)
                        TABLE 50 ASIA PACIFIC: BATTERY SEPARATORS MARKET SIZE, BY MATERIAL, 2018–2021 (USD MILLION)
                        TABLE 51 ASIA PACIFIC: BATTERY SEPARATORS MARKET SIZE, BY MATERIAL, 2022–2028 (USD MILLION)
                        TABLE 52 ASIA PACIFIC: BATTERY SEPARATORS MARKET SIZE, BY COUNTRY, 2018–2021 (USD MILLION)
                        TABLE 53 ASIA PACIFIC: BATTERY SEPARATORS MARKET SIZE, BY COUNTRY, 2022–2028 (USD MILLION)
             12.2.2 CHINA
                        12.2.2.1 Growth in production of vehicles to create demand for battery separators
                                     TABLE 54 CHINA: BATTERY SEPARATORS MARKET SIZE, BY BATTERY TYPE, 2018–2021 (USD MILLION)
                                     TABLE 55 CHINA: BATTERY SEPARATORS MARKET SIZE, BY BATTERY TYPE, 2022–2028 (USD MILLION)
             12.2.3 SOUTH KOREA
                        12.2.3.1 Growth of automotive sector to create demand for battery separators
                                     TABLE 56 SOUTH KOREA: BATTERY SEPARATORS MARKET SIZE, BY BATTERY TYPE, 2018–2021 (USD MILLION)
                                     TABLE 57 SOUTH KOREA: BATTERY SEPARATORS MARKET SIZE, BY BATTERY TYPE, 2022–2028 (USD MILLION)
             12.2.4 JAPAN
                        12.2.4.1 Growth in battery manufacturing to drive demand for battery separators
                                     TABLE 58 JAPAN: BATTERY SEPARATORS MARKET SIZE, BY BATTERY TYPE, 2018–2021 (USD MILLION)
                                     TABLE 59 JAPAN: BATTERY SEPARATORS MARKET SIZE, BY BATTERY TYPE, 2022–2028 (USD MILLION)
             12.2.5 INDIA
                        12.2.5.1 Adoption of clean energy initiatives to drive market in India
                                     TABLE 60 INDIA: BATTERY SEPARATORS MARKET SIZE, BY BATTERY TYPE, 2018–2021 (USD MILLION)
                                     TABLE 61 INDIA: BATTERY SEPARATORS MARKET SIZE, BY BATTERY TYPE, 2022–2028 (USD MILLION)
             12.2.6 TAIWAN
                        12.2.6.1 Consumer electronics sector to drive market
                                     TABLE 62 TAIWAN: BATTERY SEPARATORS MARKET SIZE, BY BATTERY TYPE, 2018–2021 (USD MILLION)
                                     TABLE 63 TAIWAN: BATTERY SEPARATORS MARKET SIZE, BY BATTERY TYPE, 2022–2028 (USD MILLION)
             12.2.7 MALAYSIA
                        12.2.7.1 Rapid economic growth to support growth of battery separators market
                                     TABLE 64 MALAYSIA: BATTERY SEPARATORS MARKET SIZE, BY BATTERY TYPE, 2018–2021 (USD MILLION)
                                     TABLE 65 MALAYSIA: BATTERY SEPARATORS MARKET SIZE, BY BATTERY TYPE, 2022–2028 (USD MILLION)
             12.2.8 REST OF ASIA PACIFIC
                        TABLE 66 REST OF ASIA PACIFIC: BATTERY SEPARATORS MARKET SIZE, BY BATTERY TYPE, 2018–2021 (USD MILLION)
                        TABLE 67 REST OF ASIA PACIFIC: BATTERY SEPARATORS MARKET SIZE, BY BATTERY TYPE, 2022–2028 (USD MILLION)
     12.3 NORTH AMERICA 
             12.3.1 IMPACT OF RECESSION
                        FIGURE 32 NORTH AMERICA: BATTERY SEPARATORS MARKET SNAPSHOT
                        TABLE 68 NORTH AMERICA: BATTERY SEPARATORS MARKET SIZE, BY BATTERY TYPE, 2018–2021 (USD MILLION)
                        TABLE 69 NORTH AMERICA: BATTERY SEPARATORS MARKET SIZE, BY BATTERY TYPE, 2022–2028 (USD MILLION)
                        TABLE 70 NORTH AMERICA: BATTERY SEPARATORS MARKET SIZE, BY END-USE INDUSTRY, 2018–2021 (USD MILLION)
                        TABLE 71 NORTH AMERICA: BATTERY SEPARATORS MARKET SIZE, BY END-USE INDUSTRY, 2022–2028 (USD MILLION)
                        TABLE 72 NORTH AMERICA: BATTERY SEPARATORS MARKET SIZE, BY MATERIAL, 2018–2021 (USD MILLION)
                        TABLE 73 NORTH AMERICA: BATTERY SEPARATORS MARKET SIZE, BY MATERIAL, 2022–2028 (USD MILLION)
                        TABLE 74 NORTH AMERICA: BATTERY SEPARATORS MARKET SIZE, BY COUNTRY, 2018–2021 (USD MILLION)
                        TABLE 75 NORTH AMERICA: BATTERY SEPARATORS MARKET SIZE, BY COUNTRY, 2022–2028 (USD MILLION)
             12.3.2 US
                        12.3.2.1 Growth in EVs and porTABLE  electronic devices market to fuel demand for battery separators
                                     TABLE 76 US: BATTERY SEPARATORS MARKET SIZE, BY BATTERY TYPE, 2018–2021 (USD MILLION)
                                     TABLE 77 US: BATTERY SEPARATORS MARKET SIZE, BY BATTERY TYPE, 2022–2028 (USD MILLION)
             12.3.3 CANADA
                        12.3.3.1 Government initiatives in battery manufacturing to create demand for battery separators
                                     TABLE 78 CANADA: BATTERY SEPARATORS MARKET SIZE, BY BATTERY TYPE, 2018–2021 (USD MILLION)
                                     TABLE 79 CANADA: BATTERY SEPARATORS MARKET SIZE, BY BATTERY TYPE, 2022–2028 (USD MILLION)
             12.3.4 MEXICO
                        12.3.4.1 Rising investments in automotive sector propelling demand for battery separators
                                     TABLE 80 MEXICO: BATTERY SEPARATORS MARKET SIZE, BY BATTERY TYPE, 2018–2021 (USD MILLION)
                                     TABLE 81 MEXICO: BATTERY SEPARATORS MARKET SIZE, BY BATTERY TYPE, 2022–2028 (USD MILLION)
     12.4 EUROPE 
             12.4.1 IMPACT OF RECESSION
                        FIGURE 33 EUROPE: BATTERY SEPARATORS MARKET SNAPSHOT
                        TABLE 82 EUROPE: BATTERY SEPARATORS MARKET SIZE, BY BATTERY TYPE, 2018–2021 (USD MILLION)
                        TABLE 83 EUROPE: BATTERY SEPARATORS MARKET SIZE, BY BATTERY TYPE, 2022–2028 (USD MILLION)
                        TABLE 84 EUROPE: BATTERY SEPARATORS MARKET SIZE, BY END-USE INDUSTRY, 2018–2021 (USD MILLION)
                        TABLE 85 EUROPE: BATTERY SEPARATORS MARKET SIZE, BY END-USE INDUSTRY, 2022–2028 (USD MILLION)
                        TABLE 86 EUROPE: BATTERY SEPARATORS MARKET SIZE, BY MATERIAL, 2018–2021 (USD MILLION)
                        TABLE 87 EUROPE: BATTERY SEPARATORS MARKET SIZE, BY MATERIAL, 2022–2028 (USD MILLION)
                        TABLE 88 EUROPE: BATTERY SEPARATORS MARKET SIZE, BY COUNTRY, 2018–2021 (USD MILLION)
                        TABLE 89 EUROPE: BATTERY SEPARATORS MARKET SIZE, BY COUNTRY, 2022–2028 (USD MILLION)
             12.4.2 GERMANY
                        12.4.2.1 Shift towards renewable energy to support market growth
                                     TABLE 90 GERMANY: BATTERY SEPARATORS MARKET SIZE, BY BATTERY TYPE, 2018–2021 (USD MILLION)
                                     TABLE 91 GERMANY: BATTERY SEPARATORS MARKET SIZE, BY BATTERY TYPE, 2022–2028 (USD MILLION)
             12.4.3 FRANCE
                        12.4.3.1 Adoption of environment-friendly vehicles to drive battery separators market
                                     TABLE 92 FRANCE: BATTERY SEPARATORS MARKET SIZE, BY BATTERY TYPE, 2018–2021 (USD MILLION)
                                     TABLE 93 FRANCE: BATTERY SEPARATORS MARKET SIZE, BY BATTERY TYPE, 2022–2028 (USD MILLION)
             12.4.4 UK
                        12.4.4.1 Growth of EV industry to create demand for battery separators in UK
                                     TABLE 94 UK: BATTERY SEPARATORS MARKET SIZE, BY BATTERY TYPE, 2018–2021 (USD MILLION)
                                     TABLE 95 UK: BATTERY SEPARATORS MARKET SIZE, BY BATTERY TYPE, 2022–2028 (USD MILLION)
             12.4.5 ITALY
                        12.4.5.1 Extensive growth of renewable sector to support market growth
                                     TABLE 96 ITALY: BATTERY SEPARATORS MARKET SIZE, BY BATTERY TYPE, 2018–2021 (USD MILLION)
                                     TABLE 97 ITALY: BATTERY SEPARATORS MARKET SIZE, BY BATTERY TYPE, 2022–2028 (USD MILLION)
             12.4.6 SPAIN
                        12.4.6.1 Growing investments to promote sale of electric vehicles to propel demand
                                     TABLE 98 SPAIN: BATTERY SEPARATORS MARKET SIZE, BY BATTERY TYPE, 2018–2021 (USD MILLION)
                                     TABLE 99 SPAIN: BATTERY SEPARATORS MARKET SIZE, BY BATTERY TYPE, 2022–2028 (USD MILLION)
             12.4.7 NETHERLANDS
                        12.4.7.1 Flourishing EV industry to fuel demand for battery separators
                                     TABLE 100 NETHERLANDS: BATTERY SEPARATORS MARKET SIZE, BY BATTERY TYPE, 2018–2021 (USD MILLION)
                                     TABLE 101 NETHERLANDS: BATTERY SEPARATORS MARKET SIZE, BY BATTERY TYPE, 2022–2028 (USD MILLION)
             12.4.8 NORWAY
                        12.4.8.1 Emergence of e-mobility to boost demand
                                     TABLE 102 NORWAY: BATTERY SEPARATORS MARKET SIZE, BY BATTERY TYPE, 2018–2021 (USD MILLION)
                                     TABLE 103 NORWAY: BATTERY SEPARATORS MARKET SIZE, BY BATTERY TYPE, 2022–2028 (USD MILLION)
             12.4.9 REST OF EUROPE
                        TABLE 104 REST OF EUROPE: BATTERY SEPARATORS MARKET SIZE, BY BATTERY TYPE, 2018–2021 (USD MILLION)
                        TABLE 105 REST OF EUROPE: BATTERY SEPARATORS MARKET SIZE, BY BATTERY TYPE, 2022–2028 (USD MILLION)
     12.5 MIDDLE EAST & AFRICA 
             TABLE 106 MIDDLE EAST & AFRICA: BATTERY SEPARATORS MARKET SIZE, BY BATTERY TYPE, 2018–2021 (USD MILLION)
             TABLE 107 MIDDLE EAST & AFRICA: BATTERY SEPARATORS MARKET SIZE, BY BATTERY TYPE, 2022–2028 (USD MILLION)
             TABLE 108 MIDDLE EAST & AFRICA: BATTERY SEPARATORS MARKET SIZE, BY END-USE INDUSTRY, 2018–2021 (USD MILLION)
             TABLE 109 MIDDLE EAST & AFRICA: BATTERY SEPARATORS MARKET SIZE, BY END-USE INDUSTRY, 2022–2028 (USD MILLION)
             TABLE 110 MIDDLE EAST & AFRICA: BATTERY SEPARATORS MARKET SIZE, BY MATERIAL, 2018–2021 (USD MILLION)
             TABLE 111 MIDDLE EAST & AFRICA: BATTERY SEPARATORS MARKET SIZE, BY MATERIAL, 2022–2028 (USD MILLION)
             TABLE 112 MIDDLE EAST & AFRICA: BATTERY SEPARATORS MARKET SIZE, BY COUNTRY, 2018–2021 (USD MILLION)
             TABLE 113 MIDDLE EAST & AFRICA: BATTERY SEPARATORS MARKET SIZE, BY COUNTRY, 2022–2028 (USD MILLION)
             12.5.1 GCC COUNTRIES
                        12.5.1.1 Saudi Arabia
                                     12.5.1.1.1 Growth in data centers is expected to drive the market
                                                     TABLE 114 SAUDI ARABIA: BATTERY SEPARATORS MARKET SIZE, BY BATTERY TYPE, 2018–2021 (USD MILLION)
                                                     TABLE 115 SAUDI ARABIA: BATTERY SEPARATORS MARKET SIZE, BY BATTERY TYPE, 2022–2028 (USD MILLION)
                        12.5.1.2 UAE
                                     12.5.1.2.1 Growth in EV market is expected to enhance the market for battery separators
                                                     TABLE 116 UAE: BATTERY SEPARATORS MARKET SIZE, BY BATTERY TYPE, 2018–2021 (USD MILLION)
                                                     TABLE 117 UAE: BATTERY SEPARATORS MARKET SIZE, BY BATTERY TYPE, 2022–2028 (USD MILLION)
                        12.5.1.3 Rest of GCC Countries
             12.5.2 SOUTH AFRICA
                        12.5.2.1 Government initiative to boost automotive sector to drive demand
                                     TABLE 118 SOUTH AFRICA: BATTERY SEPARATORS MARKET SIZE, BY BATTERY TYPE, 2018–2021 (USD MILLION)
                                     TABLE 119 SOUTH AFRICA: BATTERY SEPARATORS MARKET SIZE, BY BATTERY TYPE, 2022–2028 (USD MILLION)
             12.5.3 REST OF MIDDLE EAST & AFRICA
                        TABLE 120 REST OF MIDDLE EAST & AFRICA: BATTERY SEPARATORS MARKET SIZE, BY BATTERY TYPE, 2018–2021 (USD MILLION)
                        TABLE 121 REST OF MIDDLE EAST & AFRICA: BATTERY SEPARATORS MARKET SIZE, BY BATTERY TYPE, 2022–2028 (USD MILLION)
     12.6 SOUTH AMERICA 
             TABLE 122 SOUTH AMERICA: BATTERY SEPARATORS MARKET SIZE, BY BATTERY TYPE, 2018–2021 (USD MILLION)
             TABLE 123 SOUTH AMERICA: BATTERY SEPARATORS MARKET SIZE, BY BATTERY TYPE, 2022–2028 (USD MILLION)
             TABLE 124 SOUTH AMERICA: BATTERY SEPARATORS MARKET SIZE, BY END-USE INDUSTRY, 2018–2021 (USD MILLION)
             TABLE 125 SOUTH AMERICA: BATTERY SEPARATORS MARKET SIZE, BY END-USE INDUSTRY, 2022–2028 (USD MILLION)
             TABLE 126 SOUTH AMERICA: BATTERY SEPARATORS MARKET SIZE, BY MATERIAL, 2018–2021 (USD MILLION)
             TABLE 127 SOUTH AMERICA: BATTERY SEPARATORS MARKET SIZE, BY MATERIAL, 2022–2028 (USD MILLION)
             TABLE 128 SOUTH AMERICA: BATTERY SEPARATORS MARKET SIZE, BY COUNTRY, 2018–2021 (USD MILLION)
             TABLE 129 SOUTH AMERICA: BATTERY SEPARATORS MARKET SIZE, BY COUNTRY, 2022–2028 (USD MILLION)
             12.6.1 BRAZIL
                        12.6.1.1 Growing investment in data centers to increase demand for battery separators
                                     TABLE 130 BRAZIL: BATTERY SEPARATORS MARKET SIZE, BY BATTERY TYPE, 2018–2021 (USD MILLION)
                                     TABLE 131 BRAZIL: BATTERY SEPARATORS MARKET SIZE, BY BATTERY TYPE, 2022–2028 (USD MILLION)
             12.6.2 ARGENTINA
                        12.6.2.1 Huge lithium ore reserve along with government initiative to support market for electric vehicles
                                     TABLE 132 ARGENTINA: BATTERY SEPARATORS MARKET SIZE, BY BATTERY TYPE, 2018–2021 (USD MILLION)
                                     TABLE 133 ARGENTINA: BATTERY SEPARATORS MARKET SIZE, BY BATTERY TYPE, 2022–2028 (USD MILLION)
             12.6.3 REST OF SOUTH AMERICA
                        12.6.3.1 Growing investment in data centers to support market growth
                                     TABLE 134 REST OF SOUTH AMERICA: BATTERY SEPARATORS MARKET SIZE, BY BATTERY TYPE, 2018–2021 (USD MILLION)
                                     TABLE 135 REST OF SOUTH AMERICA: BATTERY SEPARATORS MARKET SIZE, BY BATTERY TYPE, 2022–2028 (USD MILLION)
 
13 COMPETITIVE LANDSCAPE (Page No. - 135)
     13.1 INTRODUCTION 
     13.2 KEY PLAYER STRATEGIES 
             TABLE 136 OVERVIEW OF STRATEGIES ADOPTED BY KEY MANUFACTURERS
     13.3 REVENUE ANALYSIS 
             FIGURE 34 REVENUE ANALYSIS OF KEY COMPANIES (2018–2022)
     13.4 MARKET SHARE ANALYSIS 
             13.4.1 RANKING OF KEY MARKET PLAYERS
                        FIGURE 35 RANKING OF KEY PLAYERS IN BATTERY SEPARATORS MARKET, 2022
             13.4.2 MARKET SHARE OF KEY PLAYERS
                        FIGURE 36 BATTERY SEPARATORS MARKET SHARE ANALYSIS
                        TABLE 137 BATTERY SEPARATORS MARKET: DEGREE OF COMPETITION
     13.5 COMPANY EVALUATION MATRIX (TIER 1) 
             13.5.1 STARS
             13.5.2 EMERGING LEADERS
             13.5.3 PERVASIVE PLAYERS
             13.5.4 PARTICIPANTS
                        FIGURE 37 COMPANY EVALUATION MATRIX: BATTERY SEPARATORS MARKET (TIER 1 COMPANIES)
             13.5.5 COMPANY FOOTPRINT
                        FIGURE 38 COMPANY OVERALL FOOTPRINT (18 COMPANIES)
                        TABLE 138 COMPANY BATTERY TYPE FOOTPRINT (18 COMPANIES)
                        TABLE 139 COMPANY END-USE INDUSTRY FOOTPRINT (18 COMPANIES)
                        TABLE 140 COMPANY REGION FOOTPRINT (18 COMPANIES)
     13.6 STARTUPS/SMES EVALUATION MATRIX 
             13.6.1 PROGRESSIVE COMPANIES
             13.6.2 RESPONSIVE COMPANIES
             13.6.3 DYNAMIC COMPANIES
             13.6.4 STARTING BLOCKS
                        FIGURE 39 STARTUPS/SMES EVALUATION MATRIX: BATTERY SEPARATORS MARKET
             13.6.5 COMPETITIVE BENCHMARKING
                        TABLE 141 BATTERY SEPARATORS MARKET: DETAILED LIST OF KEY STARTUPS/SMES
                        TABLE 142 BATTERY SEPARATORS MARKET: COMPETITIVE BENCHMARKING OF KEY STARTUPS/SMES
     13.7 COMPETITIVE SCENARIO AND TRENDS 
             13.7.1 DEALS
                        TABLE 143 BATTERY SEPARATORS MARKET: DEALS (2019–2023)
             13.7.2 OTHER DEVELOPMENTS
                        TABLE 144 BATTERY SEPARATORS MARKET: EXPANSIONS, INVESTMENTS, AND INNOVATIONS (2019–2023)
 
14 COMPANY PROFILES (Page No. - 153)
(Business overview, Products/Solutions/Services offered, Recent Developments, MnM view, Key strengths, Strategic choices, Weaknesses and competitive threats) *
     14.1 KEY PLAYERS 
             14.1.1 AHLSTROM
                        TABLE 145 AHLSTROM: COMPANY OVERVIEW
                        TABLE 146 AHLSTROM: PRODUCTS/SOLUTIONS/SERVICES OFFERED
                        TABLE 147 AHLSTROM: PRODUCT LAUNCHES
                        TABLE 148 AHLSTROM: DEALS
             14.1.2 ASAHI KASEI CORPORATION
                        TABLE 149 ASAHI KASEI CORPORATION: COMPANY OVERVIEW
                        FIGURE 40 ASAHI KASEI CORPORATION: COMPANY SNAPSHOT
                        TABLE 150 ASAHI KASEI CORPORATION: PRODUCTS/SOLUTIONS/SERVICES OFFERED
                        TABLE 151 ASAHI KASEI CORPORATION: DEALS
                        TABLE 152 ASAHI KASEI CORPORATION: OTHERS
             14.1.3 BERNARD DUMAS
                        TABLE 153 BERNARD DUMAS: COMPANY OVERVIEW
                        TABLE 154 BERNARD DUMAS: PRODUCTS/SOLUTIONS/SERVICES OFFERED
             14.1.4 CANGZHOU MINGZHU PLASTIC CO., LTD.
                        TABLE 155 CANGZHOU MINGZHU PLASTIC CO., LTD.: COMPANY OVERVIEW
                        FIGURE 41 CANGZHOU MINGZHU PLASTIC CO., LTD.: COMPANY SNAPSHOT
                        TABLE 156 CANGZHOU MINGZHU PLASTIC CO., LTD.: PRODUCTS/SOLUTIONS/SERVICES OFFERED
             14.1.5 DELFORTGROUP AG
                        TABLE 157 DELFORTGROUP AG: COMPANY OVERVIEW
                        TABLE 158 DELFORTGROUP AG: PRODUCTS/SOLUTIONS/SERVICES OFFERED
             14.1.6 EATON
                        TABLE 159 EATON: COMPANY OVERVIEW
                        FIGURE 42 EATON: COMPANY SNAPSHOT
                        TABLE 160 EATON: PRODUCTS/SOLUTIONS/SERVICES OFFERED
             14.1.7 ENTEK
                        TABLE 161 ENTEK: COMPANY OVERVIEW
                        TABLE 162 ENTEK: PRODUCTS/SOLUTIONS/SERVICES OFFERED
                        TABLE 163 ENTEK: DEALS
                        TABLE 164 ENTEK: OTHERS
             14.1.8 FREUDENBERG
                        TABLE 165 FREUDENBERG: COMPANY OVERVIEW
                        TABLE 166 FREUDENBERG: PRODUCTS/SOLUTIONS/SERVICES OFFERED
             14.1.9 HEBEI GELLEC NEW ENERGY SCIENCE & TECHNOLOGY CO., LTD.
                        TABLE 167 HEBEI GELLEC NEW ENERGY SCIENCE & TECHNOLOGY CO., LTD.: COMPANY OVERVIEW
                        TABLE 168 HEBEI GELLEC NEW ENERGY SCIENCE & TECHNOLOGY CO., LTD.: PRODUCTS/SOLUTIONS/SERVICES OFFERED
             14.1.10 MITSUBISHI PAPER MILLS LIMITED
                        TABLE 169 MITSUBISHI PAPER MILLS LIMITED: COMPANY OVERVIEW
                        FIGURE 43 MITSUBISHI PAPER MILLS LIMITED: COMPANY SNAPSHOT
                        TABLE 170 MITSUBISHI PAPER MILLS LIMITED: PRODUCTS/SOLUTIONS/SERVICES OFFERED
             14.1.11 HOLLINGSWORTH & VOSE
                        TABLE 171 HOLLINGSWORTH & VOSE: COMPANY OVERVIEW
                        TABLE 172 HOLLINGSWORTH & VOSE: PRODUCTS/SOLUTIONS/SERVICES OFFERED
                        TABLE 173 HOLLINGSWORTH & VOSE: OTHERS
             14.1.12 NANOGRAFI NANO TECHNOLOGY
                        TABLE 174 NANOGRAFI NANO TECHNOLOGY: COMPANY OVERVIEW
                        TABLE 175 NANOGRAFI NANO TECHNOLOGY: PRODUCTS/SOLUTIONS/SERVICES OFFERED
             14.1.13 SK IE TECHNOLOGY CO., LTD
                        TABLE 176 SK IE TECHNOLOGY CO., LTD.: COMPANY OVERVIEW
                        FIGURE 44 SK IE TECHNOLOGY CO., LTD.: COMPANY SNAPSHOT
                        TABLE 177 SK IE TECHNOLOGY CO., LTD.: PRODUCTS/SOLUTIONS/SERVICES OFFERED
                        TABLE 178 SK IE TECHNOLOGY CO., LTD: DEALS
                        TABLE 179 SK IE TECHNOLOGY CO., LTD: OTHERS
             14.1.14 SOLVAY
                        TABLE 180 SOLVAY: COMPANY OVERVIEW
                        FIGURE 45 SOLVAY: COMPANY SNAPSHOT
                        TABLE 181 SOLVAY: PRODUCTS/SOLUTIONS/SERVICES OFFERED
                        TABLE 182 SOLVAY: DEALS
                        TABLE 183 SOLVAY: OTHERS
             14.1.15 SUMITOMO CHEMICAL CO., LTD.
                        TABLE 184 SUMITOMO CHEMICAL CO., LTD.: COMPANY OVERVIEW
                        FIGURE 46 SUMITOMO CHEMICAL CO., LTD.: COMPANY SNAPSHOT
                        TABLE 185 SUMITOMO CHEMICAL CO., LTD.: PRODUCTS/SOLUTIONS/SERVICES OFFERED
                        TABLE 186 SUMITOMO CHEMICAL CO., LTD.: DEALS
             14.1.16 TEIJIN LIMITED
                        TABLE 187 TEIJIN LIMITED: COMPANY OVERVIEW
                        FIGURE 47 TEIJIN LIMITED: COMPANY SNAPSHOT
                        TABLE 188 TEIJIN LIMITED: PRODUCTS/SOLUTIONS/SERVICES OFFERED
                        TABLE 189 TEIJIN LIMITED: DEALS
             14.1.17 SINOMA SCIENCE & TECHNOLOGY CO., LTD.
                        TABLE 190 SINOMA SCIENCE & TECHNOLOGY CO., LTD.: COMPANY OVERVIEW
                        TABLE 191 SINOMA SCIENCE & TECHNOLOGY CO., LTD.: PRODUCTS/SOLUTIONS/ SERVICES OFFERED
             14.1.18 UBE CORPORATION
                        TABLE 192 UBE CORPORATION: COMPANY OVERVIEW
                        FIGURE 48 UBE CORPORATION: COMPANY SNAPSHOT
                        TABLE 193 UBE CORPORATION: PRODUCTS/SOLUTIONS/SERVICES OFFERED
                        TABLE 194 UBE CORPORATION: OTHERS
             14.1.19 TORAY INDUSTRIES, INC.
                        TABLE 195 TORAY INDUSTRIES, INC.: COMPANY OVERVIEW
                        FIGURE 49 TORAY INDUSTRIES, INC.: COMPANY SNAPSHOT
                        TABLE 196 TORAY INDUSTRIES, INC.: PRODUCTS/SOLUTIONS/SERVICES OFFERED
                        TABLE 197 TORAY INDUSTRIES, INC.: PRODUCT LAUNCHES
                        TABLE 198 TORAY INDUSTRIES, INC.: DEALS
             14.1.20 SHANGHAI ENERGY NEW MATERIALS TECHNOLOGY CO., LTD.
                        TABLE 199 SHANGHAI ENERGY NEW MATERIALS TECHNOLOGY CO., LTD.: COMPANY OVERVIEW
                        TABLE 200 SHANGHAI ENERGY NEW MATERIALS TECHNOLOGY CO., LTD.: PRODUCTS OFFERED
                        TABLE 201 SHANGHAI ENERGY NEW MATERIALS TECHNOLOGY CO., LTD.: DEALS
                        TABLE 202 SHANGHAI ENERGY NEW MATERIALS TECHNOLOGY CO., LTD.: OTHERS
             14.1.21 W-SCOPE CORPORATION
                        TABLE 203 W-SCOPE CORPORATION: COMPANY OVERVIEW
                        FIGURE 50 W-SCOPE CORPORATION: COMPANY SNAPSHOT
                        TABLE 204 W-SCOPE CORPORATION: PRODUCTS/SOLUTIONS/SERVICES OFFERED
                        TABLE 205 W-SCOPE CORPORATION: PRODUCT LAUNCHES
                        TABLE 206 W-SCOPE CORPORATION: OTHERS
     14.2 OTHER PLAYERS 
             14.2.1 AMER-SIL
                        TABLE 207 AMER-SIL: COMPANY OVERVIEW
                        TABLE 208 AMER-SIL: PRODUCTS/SOLUTIONS/SERVICES OFFERED
                        TABLE 209 AMER-SIL: OTHERS
             14.2.2 B&F TECHNOLOGY
                        TABLE 210 B&F TECHNOLOGY: COMPANY OVERVIEW
                        TABLE 211 B&F TECHNOLOGY: PRODUCTS/SOLUTIONS/SERVICES OFFERED
             14.2.3 COPERION GMBH
                        TABLE 212 COPERION GMBH: COMPANY OVERVIEW
                        TABLE 213 COPERION GMBH: PRODUCTS/SOLUTIONS/SERVICES OFFERED
             14.2.4 MICROTEX ENERGY PRIVATE LIMITED
                        TABLE 214 MICROTEX ENERGY PRIVATE LIMITED: COMPANY OVERVIEW
                        TABLE 215 MICROTEX ENERGY PRIVATE LIMITED: PRODUCTS/SOLUTIONS/SERVICES OFFERED
             14.2.5 YOUME
                        TABLE 216 YOUME: COMPANY OVERVIEW
                        TABLE 217 YOUME: PRODUCTS/SOLUTIONS/SERVICES OFFERED
 
*Details on Business overview, Products/Solutions/Services offered, Recent Developments, MnM view, Key strengths, Strategic choices, Weaknesses and competitive threats might not be captured in case of unlisted companies.
 
15 ADJACENT AND RELATED MARKETS (Page No. - 210)
     15.1 INTRODUCTION 
     15.2 LIMITATIONS 
     15.3 BATTERY SEPARATORS INTERCONNECTED MARKETS 
             15.3.1 LITHIUM METAL MARKET
                        15.3.1.1 Market definition
                        15.3.1.2 Market overview
                        15.3.1.3 Lithium metal market, by source
                                     15.3.1.3.1 Salt lake brine
                                     15.3.1.3.2 Lithium ore
                                                     TABLE 218 LITHIUM METAL MARKET, BY SOURCE, 2019–2022 (TON)
                                                     TABLE 219 LITHIUM METAL MARKET, BY SOURCE, 2023–2028 (TON)
                                                     TABLE 220 LITHIUM METAL MARKET, BY SOURCE, 2019–2022 (USD MILLION)
                                                     TABLE 221 LITHIUM METAL MARKET, BY SOURCE, 2023–2028 (USD MILLION)
 
16 APPENDIX (Page No. - 213)
     16.1 DISCUSSION GUIDE 
     16.2 KNOWLEDGESTORE: MARKETSANDMARKETS’ SUBSCRIPTION PORTAL 
     16.3 CUSTOMIZATION OPTIONS 
     16.4 RELATED REPORTS 
     16.5 AUTHOR DETAILS 

The study involved four major activities in estimating the current size of the battery separators market. Exhaustive secondary research was done to collect information on the market, peer markets, and parent market. The next step was to validate these findings, assumptions, and sizing with the industry experts across the battery separators value chain through primary research. Both top-down and bottom-up approaches were employed to estimate the complete market size. Thereafter, market breakdown and data triangulation were used to estimate the market size of segments and subsegments.

Secondary Research

Secondary sources for this research study include annual reports, press releases, and investor presentations of companies; white papers; certified publications; and articles by recognized authors; gold- and silver-standard websites; battery separators manufacturing companies, regulatory bodies, trade directories, and databases. The secondary research was mainly used to obtain key information about the industry’s supply chain, the total pool of key players, market classification, and segmentation according to industry trends to the bottom-most level and regional markets. It has also been used to obtain information about key developments from a market-oriented perspective.

Primary Research

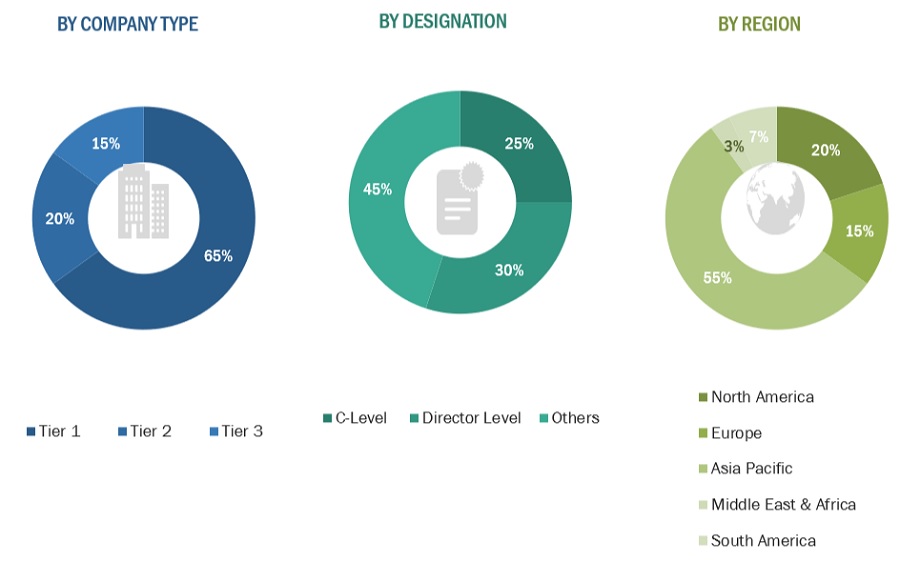
The battery separators market  comprises several stakeholders, such as such as raw material suppliers, technology support providers, battery separators manufacturers, and regulatory organizations in the supply chain. Various primary sources from both the supply and demand sides of the market were interviewed to obtain qualitative and quantitative information. Primary sources from the supply side included industry experts such as Chief Executive Officers (CEOs), vice presidents, marketing directors, technology and innovation directors, and related key executives from various key companies and organizations operating in the battery separators market . Primary sources from the demand side included directors, marketing heads, and purchase managers from various sourcing industries. Following is the breakdown of the primary respondents:
Battery Separators Market Size, and Share

To know about the assumptions considered for the study, download the pdf brochure

Market Size Estimation

Both the top-down and bottom-up approaches have been used to estimate and validate the total size of the battery separators market. These approaches have also been used extensively to estimate the size of various dependent subsegments of the market. The research methodology used to estimate the market size included the following:

The following segments provide details about the overall market size estimation process employed in this study

  • The key players in the market were identified through secondary research.
  • The market shares in the respective regions were identified through primary and secondary research.
  • The value chain and market size of the battery separators market, in terms of value, were determined through primary and secondary research.
  • All percentage shares, splits, and breakdowns were determined using secondary sources and verified through primary sources.
  • All possible parameters that affect the market covered in this research study were accounted for, viewed in extensive detail, verified through primary research, and analyzed to obtain the final quantitative and qualitative data.
  • The research included the study of annual and financial reports of the top market players and interviews with industry experts, such as CEOs, VPs, directors, sales managers, and marketing executives, for key insights, both quantitative and qualitative.

Global Battery separators market  Size: Bottom-Up Approach

Battery Separators Market Size, and Share

To know about the assumptions considered for the study, Request for Free Sample Report

Global Battery separators market  Size: Top-Down Approach

Battery Separators Market Size, and Share

Data Triangulation

After arriving at the overall market size using the market size estimation processes as explained above, the market was split into several segments and sub-segments. To complete the overall market engineering process and arrive at the exact statistics of each market segment and subsegment, the data triangulation and market breakdown procedures were employed, wherever applicable. The data was triangulated by studying various factors and trends from both the demand and supply sides in the oil & gas sector.

Market Definition

According to Hollingsworth & Vose, a battery separator is a polymeric membrane placed between the positively charged anode and the negatively charged cathode. The separators act as isolators. Ions can freely go across separators, but these are not electrically conductive. The main purpose of battery separators is to isolate the negative and positive electrodes. They must obstruct any processes which negatively affect the electrochemical energy efficiency of a battery. This helps in avoiding electrical short circuits while permitting rapid transportation of ionic charge carriers to complete the circuit during the transit of current in an electrochemical cell.

Key Stakeholders

  • Raw material manufacturers
  • Technology support providers
  • Manufacturers of battery separators
  • Traders, distributors, and suppliers
  • Regulatory Bodies and Government Agencies
  • Research & Development (R&D) Institutions
  • End-use Industries
  • Consulting Firms, Trade Associations, and Industry Bodies
  • Investment Banks and Private Equity Firms

Report Objectives

  • To analyze and forecast the market size of battery separators market in terms of value
  • To provide detailed information regarding the major factors (drivers, restraints, challenges, and opportunities) influencing the regional market
  • To analyze and forecast the global battery separators market on the basis of battery type, thickness, type, technology, material, end-use, and region
  • To analyze the opportunities in the market for stakeholders and provide details of a competitive landscape for market leaders
  • To forecast the size of various market segments based on four major regions: North America, Europe, Asia Pacific, South America, and the Middle East & Africa, along with their respective key countries
  • To track and analyze the competitive developments, such as acquisitions, partnerships, collaborations, agreements and expansions in the market
  • To strategically profile the key players and comprehensively analyze their market shares and core competencies

Available Customizations

With the given market data, MarketsandMarkets offers customizations according to the client-specific needs.

The following customization options are available for the report:

  • Additional country-level analysis of the battery separators market
  • Profiling of additional market players (up to 5)

Product Analysis

  • Product matrix, which gives a detailed comparison of the product portfolio of each company.
Custom Market Research Services

We will customize the research for you, in case the report listed above does not meet with your exact requirements. Our custom research will comprehensively cover the business information you require to help you arrive at strategic and profitable business decisions.

Request Customization

Instant Answers with GPT - Ask Now!

Ask real questions. Get complete answers !
Report Code
CH 5958
Published ON
Jan, 2024
Choose License Type
BUY NOW
  • SHARE
X
Request Customization
Speak to Analyst
Speak to Analyst
OR FACE-TO-FACE MEETING
PERSONALIZE THIS RESEARCH
  • Triangulate with your Own Data
  • Get Data as per your Format and Definition
  • Gain a Deeper Dive on a Specific Application, Geography, Customer or Competitor
  • Any level of Personalization
REQUEST A FREE CUSTOMIZATION
LET US HELP YOU!
  • What are the Known and Unknown Adjacencies Impacting the Battery Separators Market
  • What will your New Revenue Sources be?
  • Who will be your Top Customer; what will make them switch?
  • Defend your Market Share or Win Competitors
  • Get a Scorecard for Target Partners
CUSTOMIZED WORKSHOP REQUEST
+1-888-600-6441
  • Call Us
  • +1-888-600-6441 (Corporate office hours)
  • +1-888-600-6441 (US/Can toll free)
  • +44-800-368-9399 (UK office hours)
CONNECT WITH US
ABOUT TRUST ONLINE
©2024 MarketsandMarkets Research Private Ltd. All rights reserved
DMCA.com Protection Status Website Feedback