Geotextile Tubes Market by Type (Woven, Nonwoven), End-use (Marine & Hydraulic, Environmental Engineering, Agricultural Engineering, Construction), and Region (Europe, North America, APAC, MEA, South America) - Global Forecast to 2024


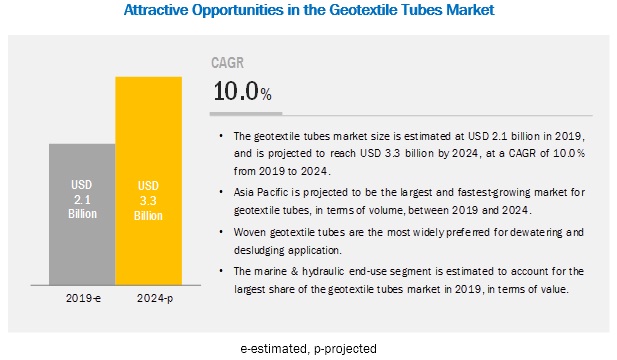
The geotextile tubes market is projected to reach USD 3.3 billion by 2024, at a CAGR of 10.0%. Consumption of geotextile tubes is rising globally and can be attributed to the rising consumption in the end-use industries. Geotextile tubes are used for dewatering and desludging applications as it helps to prevent or minimize the leakage of contaminants to the environment during the processing, transit, and final disposal of contaminants. The sludge collected in tubes generates methane, which can be used to generate electricity.
Based on type, woven geotextile tubes segment is projected to grow at the higher CAGR during the forecast period
Based on type, woven geotextile tubes are expected to grow at the highest CAGR between 2019 and 2024. Woven geotextile tubes are manufactured by sewing one or more layers of high strength permeable woven geotextile fabric together to form a tube which is later filled with high water content materials by hydraulic pumping. Woven geotextile tube has fine porosity and has superior tensile strength, which allows efficient filtration. With increasing awareness and rise in ocean levels, the growth in consumption of geotextile tubes is expected to increase during the forecast period.
The rising level of the ocean and increased coastal erosion has increased the demand for geotextile tubes globally
Based on end-use, the marine & hydraulic segment is projected to grow at the higher CAGR between 2019 and 2024. The global marine & hydraulic segment has been showing robust growth in recent years due to the geotextile technology has been improving due to continuous advancements in its engineering principles and fabrication techniques. Each geotube, geobag or geocontainer is designed with well-structured design formulas and different specifications depending on the scientific properties of numerous marine coasts. For instance, sandy beach coasts have higher wave energy than muddy coast beaches. Thus, sandy beaches require high strength geotubes with specific height designs to withstand the wave forces. Additionally, sandy beach coasts also have higher bed shear strength in comparison to the bed shear strength of muddy coasts. Thus, the installation of geotextile tubes on muddy coasts leads to high maintenance costs in the long term due to the structural settlement of heavy weighted structures.
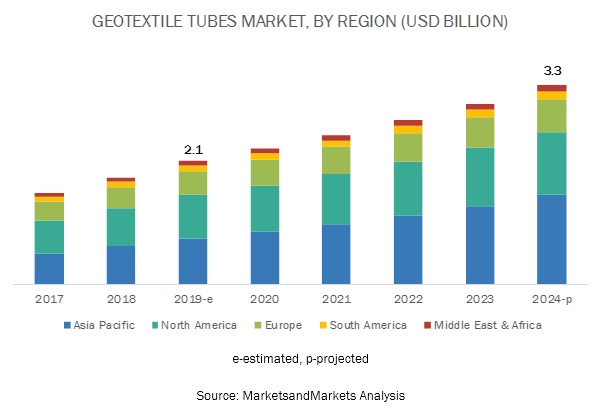
The market in Asia Pacific is projected to grow at the highest CAGR in the geotextile tubes market during the forecast period
The geotextile tubes market in Asia Pacific is expected to grow at the highest CAGR during the forecast period. This can be attributed to the long coastline of the region and rising concerns over increasing ocean levels.
Furthermore, emerging countries such as China, India, and Mexico are attracting global players in establishing their manufacturing bases in these regions. In countries such as China and India, the increasing investments by the government in the infrastructure activities are expected to provide major boost to this market. The increased investments across various technological, infrastructural, and R&D sectors have enabled manufacturers of geotextile tubes to supply high-quality products to these end-users and capitalize on the increasing demand in the region. After APAC, North America has the highest CAGR during the forecast period. This region is witnessing growth in all the major end-use segments, which is maintaining the high consumption of geotextile tubes.
Key Market Players in Geotextile Tubes Market
Major companies in the geotextile tubes market include Ace Geosynthetics (Taiwan), Officine Maccaferri (Italy), Low & Bonar (UK), Flexituff Ventures International Limited (India), TechFab India Industries Ltd (India), Geofabrics Australasia Pty Ltd (Australia), Koninklijke TenCate (Netherlands), NAUE GmbH & Co. KG (Germany), Huesker (Germany), and Fibertex Nonwovens (Denmark) are some of the leading players operating in the geotextile tubes market. These players have adopted expansions, acquisitions, new product launches, supply contracts, collaboration, distribution agreement, and divestment as the major strategies to consolidate their positions in the market. Supply contracts have been the dominant strategy adopted by major players between 2013 and 2019.
Geotextile Tubes Market Report Scope:
|
Report Metric |
Details |
|
Market size available for years |
2017-2024 |
|
Base year considered |
2018 |
|
Forecast period |
2019-2024 |
|
Forecast units |
Volume (Square meters), Value (USD) |
|
Segments covered |
Type, End-Use, and Region |
|
Geographies covered |
Asia Pacific, North America, Europe, Middle East & Africa, and South America |
|
Companies covered |
Ace Geosynthetics (Taiwan), Officine Maccaferri (Italy), Low & Bonar (UK), Flexituff Ventures International Limited (India), TechFab India Industries Ltd (India), Geofabrics Australasia Pty Ltd (Australia), Koninklijke TenCate (Netherlands), NAUE GmbH & Co. KG (Germany), Huesker (Germany), Fibertex Nonwovens (Denmark). Total 20 major players covered. |
This research report categorizes the geotextile tubes market based on type, end-use, and region.
Geotextile tubes Market, By End-use
- Marine & Hydraulic
- Environmental Engineering
- Agricultural Engineering
- Construction
Geotextile tubes Market, By Type
- Woven
- Nonwoven
Geotextile tubes Market, By Region
- Asia Pacific
- North America
- Europe
- Middle East & Africa
- South America
Recent Developments
- In October 2018, TenCate Geosynthetics Americas started its new production line of non-woven geotextiles at its Jefferson, Georgia facility. The facility has advanced fiber distribution capabilities and the largest cross lapper to produce both polypropylene and polyester geotextiles. With this expansion, the company catered to the increasing demand for high-quality non-woven geotextiles.
- In September 2017, HUESKER Russia started production at its Klin facility (Russia). The new facility is spread across 5,000 m² and is engaged in the production of tried-and-tested geotextiles such as HaTelit, Basetrac, and Stabilenka. Additionally, the production site manufactured several products locally to cater to the hydraulics and environmental engineering segment. With this expansion, the company strengthened its position in the European market.
- In June 2016, Maccaferri opened a new state-of-the-art facility in Senica, Slovakia. The manufacturing plant has a total area of 28,000 m2 with a floor area of 11,000 m2. The facility increased and optimized the production capacity of geosynthetics. Additionally, the construction of this facility helped the company in expanding its global presence across Central and Western Europe.
Key Questions addressed by the report
- How is the use of geotextile tubes in the marine & hydraulic segment affecting the market?
- How is the increased penetration of geotextile tubes in emerging countries impacting the market?
- How are expansions helping the growth of the geotextile tubes market?
- Who are the leading players in the geotextile tubes market?
- How is volatility in the prices of raw materials expected to affect the geotextile tubes market?
Frequently Asked Questions (FAQ):
What types of geotextile tubes are available in the global market?
Geotextile tubes are also known as geotubes or dewatering tubes. There are majorly two types of geotextile tubes available in the global market – Woven and Non-woven.
They are made from permeable textile materials or fabrics such as polypropylene and polyester, in the form of large sludge dewatering bags or geo-containers. These tubes can work with any material that is hydraulically transported
Which type of geotextile tube is experiencing high demand in the global geotextile tubes market?
Woven geotextile tubes dominated the global geotextile market in2019 and is estimated to lead the global geotextile tubes market during the forecast period. Woven geotextile tubes are manufactured by sewing one or more layers of high strength permeable woven geotextile fabric together to form a tube which is later filled with high water content materials by hydraulic pumping.
What are the major end use of the geotextile tubes?
The end use of geotextile tubes includes Marine & Hydraulic, Environmental Engineering, Agricultural Engineering and Construction. Among all these end uses; Marine & hydraulic segment recorded the highest consumption of the geotextile tubes in 2019.
What are the major factors driving the growth of the geotextile tubes market?
Factors such as rising ocean levels and protection of coastlines and growing awareness regarding the treatment of contaminated sludge are few of the factors driving the growth of the geotextile market. The rising level of oceans and seas—due to the increase in temperature—is a major factor causing coastal erosion. Geotextile tubes are widely used to mitigate the risk of coastal erosion as their porous structure drains water while retaining sand. These tubes are an economical alternative to the construction of offshore reefs and seawalls for coastal protection.
Further, geotextile tubes are flexible tubular containment vessels that effectively drain water but retain solid materials and are widely used to dewater sewage sludge and hazardous waste. Thus, rising treatment of contaminated sludge, is also propelling the demand for the geotextile tubes.
What is biggest restraint for the geotextile tubes market?
Volatility in the price of raw materials for geotextile tubes is considered as one of the major restraints to the market growth. Polypropylene, polyester, polyamide, and polyethylene are critical raw materials used to manufacture geotextile tubes. Dependency of these raw materials to crude oil, creates volatility in the price of raw materials, with the changing price of crude oil.
Who are the major manufacturers of geotextile tubes?
The major manufacturers for geotextile tubes market are Ace Geosynthetics (Taiwan), Officine Maccaferri (Italy), Low & Bonar (UK), Flexituff Ventures International Limited (India), TechFab India Industries Ltd (India), Geofabrics Australasia Pty Ltd (Australia), Koninklijke TenCate (Netherlands), NAUE GmbH & Co. KG (Germany), Huesker (Germany), and Fibertex Nonwovens (Denmark) .
Which region is expected to record the fastest growth in the geotextile market and why?
The geotextile tubes market in the Asia Pacific region is expected to grow at the highest CAGR during the forecast period. The growth of the market can be attributed to the presence of emerging economies such as China, Japan, South Korea, and India in the region. These countries offer growth opportunities to the players operating in the geotextile tubes market. Increasing construction activities and rising awareness regarding coastal erosion are some of the other factors expected to fuel the growth of the market in the region.
Why woven geotextile tubes are preferred over non-woven geotextile tubes?
Woven geotextile tubes are manufactured by sewing multiple sheets of polyester or polypropylene fabrics to create an enclosed tube. Non-woven geotextile tubes are not as efficient as woven geotextile tubes as they breakdown faster due to their structural form. Thus, the superior strength and efficiency of woven geotextile, is contributing to the higher demand for this segment. .
To speak to our analyst for a discussion on the above findings, click Speak to Analyst
Table of Contents
1 Introduction (Page No. - 17)
1.1 Objectives of the Study
1.2 Market Definition
1.3 Market Scope
1.3.1 Years Considered for the Study
1.4 Currency
1.5 Stakeholders
1.6 Limitations
2 Research Methodology (Page No. - 20)
2.1 Research Data
2.1.1 Secondary Data
2.1.1.1 Key Data From Secondary Sources
2.1.2 Primary Data
2.1.2.1 Key Data From Primary Sources
2.1.2.2 Key Industry Insights
2.1.2.3 Breakdown of Primary Interviews
2.2 Market Size Estimation
2.3 Data Triangulation
2.4 Assumptions
3 Executive Summary (Page No. - 27)
4 Premium Insights (Page No. - 31)
4.1 Attractive Growth Opportunities in Geotextile Tubes Market
4.2 Geotextile Tubes Market, By Type
4.3 Geotextile Tubes Market, By End Use
4.4 Geotextile Tubes Market, By Region
5 Market Overview (Page No. - 33)
5.1 Introduction
5.2 Market Dynamics
5.2.1 Drivers
5.2.1.1 Rising Ocean Levels and Protection of Coastlines
5.2.1.2 Recovery of Beaches for Tourism
5.2.1.3 Increasing Use for Waste Treatment in the Mining Industry
5.2.1.4 Treatment of Contaminated Sludge
5.2.1.5 Investments in Emerging Economies
5.2.2 Restraints
5.2.2.1 Volatility in the Price of Raw Materials
5.2.2.2 Product Accreditation and Quality Control
5.2.3 Opportunities
5.2.3.1 Environment-Friendly Technology
5.2.4 Challenges
5.2.4.1 Installation of Geotextile Tubes in Sandy and Muddy Coastal Areas
5.3 Porter’s Five Forces Analysis
5.3.1 Threat of New Entrants
5.3.2 Threat of Substitutes
5.3.3 Bargaining Power of Suppliers
5.3.4 Bargaining Power of Buyers
5.3.5 Intensity of Competitive Rivalry
6 Industry Trends (Page No. - 41)
6.1 Macroeconomic Indicators
6.1.1 Industry Outlook
6.1.1.1 Oil & Gas
6.1.1.2 Construction
7 Regulations (Page No. - 45)
7.1 Introduction
7.2 Lab Accreditations
8 Geotextile Tubes Market, By Type (Page No. - 50)
8.1 Introduction
8.2 Woven Geotextile Tubes
8.2.1 Asia Pacific to Dominate the Woven Type Segment of the Geotextile Tubes Market By 2024
8.3 Nonwoven Geotextile Tubes
8.3.1 Asia Pacific to Dominate the Nonwoven Type Segment of the Geotextile Tubes Market During the Forecast Period
9 Geotextile Tubes Market, By End Use (Page No. - 55)
9.1 Introduction
9.2 Marine & Hydraulic
9.2.1 Asia Pacific to Dominate the Marine & Hydraulic End Use Segment of the Geotextile Tubes Market During the Forecast Period
9.3 Environmental Engineering
9.3.1 Asia Pacific to Dominate the Environmental Engineering End Use Segment of the Geotextile Tubes Market By 2024
9.4 Agricultural Engineering
9.4.1 Asia Pacific to Dominate the Agricultural Engineering End Use Segment of the Geotextile Tubes Market During the Forecast Period
9.5 Construction
9.5.1 North America to Dominate the Construction End Use Segment of the Geotextile Tubes Market During the Forecast Period
10 Regional Analysis (Page No. - 65)
10.1 Introduction
10.2 Asia Pacific
10.2.1 China
10.2.1.1 Woven Geotextile Tubes are Widely Used in China for Environmental Engineering and Marine & Hydraulic Applications
10.2.2 India
10.2.2.1 Marine & Hydraulic Segment of India Geotextile Tubes Market is Projected to Grow at the Highest CAGR Between 2019 and 2024
10.2.3 Japan
10.2.3.1 Woven Segment is Projected to Lead Japan Geotextile Tubes Market From 2019 to 2024
10.2.4 South Korea
10.2.4.1 Marine & Hydraulic Segment of South Korea Geotextile Tubes Market is Projected to Grow at the Highest CAGR Between 2019 and 2024
10.2.5 Rest of Asia Pacific
10.3 North America
10.3.1 US
10.3.1.1 US is Projected to Be the Largest and the Fastest-Growing Market for Geotextile Tubes in North America
10.3.2 Canada
10.3.2.1 Woven Type Segment is Projected to Lead Canada Geotextile Tubes Market From 2019 to 2024
10.3.3 Mexico
10.3.3.1 Marine & Hydraulic is the Largest and the Fastest-Growing End Use Segment of Mexico Geotextile Tubes Market
10.4 Europe
10.4.1 Germany
10.4.1.1 Marine & Hydraulic End Use Segment of Germany Geotextiles Market is Projected to Grow at the Highest CAGR From 2019 to 2024
10.4.2 France
10.4.2.1 Woven Type Segment is Projected to Lead France Geotextile Tubes Market Between 2019 and 2024
10.4.3 Italy
10.4.3.1 Marine & Hydraulic End Use Segment of Italy Geotextile Tubes Market is Projected to Grow at the Highest CAGR From 2019 to 2024
10.4.4 UK
10.4.4.1 Marine & Hydraulic is the Fastest Growing End Use Segment in UK
10.4.5 Spain
10.4.5.1 Woven Type Segment is Projected to Lead Spain Geotextile Tubes Market From 2019 to 2024 in Terms of Value
10.4.6 Rest of Europe
10.5 Middle East & Africa
10.5.1 Saudi Arabia
10.5.1.1 Woven Type Segment is Projected to Lead Saudi Arabia Geotextile Tubes Market Between 2019 and 2024
10.5.2 South Africa
10.5.2.1 Marine & Hydraulic End Use Segment of South Africa Geotextile Tubes Market is Projected to Grow at the Highest CAGR From 2019 to 2024
10.5.3 Rest of Middle East & Africa
10.6 South America
10.6.1 Brazil
10.6.1.1 Marine & Hydraulic End Use Segment of Brazil Geotextiles Market is Projected to Grow at the Highest CAGR Between 2019 and 2024
10.6.2 Argentina
10.6.2.1 Marine & Hydraulic End Use Segment of Argentina Geotextiles Market is Projected to Grow at the Highest CAGR From 2019 to 2024
10.6.3 Rest of South America
11 Competitive Landscape (Page No. - 108)
11.1 Overview
11.2 Competitive Leadership Mapping, 2019
11.2.1 Specialists
11.2.2 Innovators
11.2.3 Leaders
11.2.4 Challengers
11.3 Competitive Benchmarking
11.3.1 Strength of Product Portfolio
11.3.2 Business Strategy Excellence
11.4 Market Ranking of Key Players
11.5 Competitive Scenario
11.5.1 Acquisitions
11.5.2 Expansions
11.5.3 New Product Launches
11.5.4 Supply Contracts
11.5.5 Collaborations
11.5.6 Distribution Agreements
11.5.7 Divestments
12 Company Profiles (Page No. - 119)
(Business Overview, Products Offered, Recent Developments, SWOT Analysis, MnM View)*
12.1 Koninklijke Tencate
12.2 Naue GmbH & Co. Kg
12.3 Huesker
12.4 Fibertex Nonwovens
12.5 Geofabrics Australasia Pty Ltd
12.6 Ace Geosynthetics
12.7 Officine Maccaferri
12.8 Low & Bonar (Enka Solutions)
12.9 Flexituff Ventures International Ltd.
12.10 Techfab India Industries Ltd
12.11 Other Companies
12.11.1 Titan Environmental Containment
12.11.2 Tensar International
12.11.3 Zebratube
12.11.4 Geobera
12.11.5 Global Synthetics Pty Ltd
12.11.6 Industrial Fabrics, Inc
12.11.7 Willacoochee Industrial Fabrics (Winfab)
12.11.8 Thrace Group
12.11.9 Flint Industries
12.11.10 Hock Technology Co., Ltd
*Details on Business Overview, Products Offered, Recent Developments, SWOT Analysis, MnM View Might Not Be Captured in Case of Unlisted Companies.
13 Appendix (Page No. - 151)
13.1 Discussion Guide
13.2 Knowledge Store: Marketsandmarkets Subscription Portal
13.3 Available Customizations
13.4 Related Reports
13.5 Author Details
List of Tables (139 Tables)
Table 1 Geotextile Tubes Market Snapshot
Table 2 Projected Contribution of the Construction Industry to GDP of Various Countries From 2014 to 2021 (USD Billion)
Table 3 Various Tests for Physical Properties of Geotextile Tubes
Table 4 Recognized Independent Geotextile Testing Laboratories
Table 5 Geotextile Tubes Market, By Type, 2019–2024 (USD Million)
Table 6 Geotextile Tubes Market, By Type, 2019–2024 (Million Square Meters)
Table 7 Woven Geotextile Tubes Market, By Region, 2017–2024 (USD Million)
Table 8 Woven Geotextile Tubes Market, By Region, 2017–2024 (Million Square Meters)
Table 9 Nonwoven Geotextile Tubes Market, By Region, 2017–2024 (USD Million)
Table 10 Nonwoven Geotextile Tubes Market, By Region, 2017–2024 (Million Square Meters)
Table 11 Geotextile Tubes Market, By End Use, 2017–2024 (USD Million)
Table 12 Geotextile Tubes Market, By End Use, 2017–2024 (Million Square Meters)
Table 13 Geotextile Tubes Market for Marine & Hydraulic, By Region, 2017–2024 (USD Million)
Table 14 Geotextile Tubes Market for Marine & Hydraulic, By Region, 2017–2024 (Million Square Meters)
Table 15 Geotextile Tubes Market for Environmental Engineering, By Region, 2017–2024 (USD Million)
Table 16 Geotextile Tubes Market for Environmental Engineering, By Region, 2017–2024 (Million Square Meters)
Table 17 Geotextile Tubes Market for Agricultural Engineering, By Region, 2017–2024 (USD Million)
Table 18 Geotextile Tubes Market for Agricultural Engineering, By Region, 2017–2024 (Million Square Meters)
Table 19 Geotextile Tubes Market for Construction, By Region, 2017–2024 (USD Million)
Table 20 Geotextile Tubes Market for Construction, By Region, 2017–2024 (Million Square Meters)
Table 21 Geotextile Tubes Market, By Region, 2017–2024 (USD Million)
Table 22 Geotextile Tubes Market, By Region, 2017–2024 (Million Square Meters)
Table 23 Asia Pacific Geotextile Tubes Market, By Country, 2017–2024 (USD Million)
Table 24 Asia Pacific Geotextile Tubes Market, By Country, 2017–2024 (Million Square Meters)
Table 25 Asia Pacific Geotextile Tubes Market, By End Use, 2017–2024 (USD Million)
Table 26 Asia Pacific Geotextile Tubes Market, By End Use, 2017–2024 (Million Square Meters)
Table 27 Asia Pacific Geotextile Tubes Market, By Type, 2017–2024 (USD Million)
Table 28 Asia Pacific Geotextile Tubes Market, By Type, 2017–2024 (Million Square Meters)
Table 29 China Geotextile Tubes Market, By End Use, 2017–2024 (USD Million)
Table 30 China Geotextile Tubes Market, By End Use, 2017–2024 (Million Square Meters)
Table 31 China Geotextile Tubes Market, By Type, 2017–2024 (USD Million)
Table 32 China Geotextile Tubes Market, By Type, 2017–2024 (Million Square Meters)
Table 33 India Geotextile Tubes Market, By End Use, 2017–2024 (USD Million)
Table 34 India Geotextile Tubes Market, By End Use, 2017–2024 (Million Square Meters)
Table 35 India Geotextile Tubes Market, By Type, 2017–2024 (USD Million)
Table 36 India Geotextile Tubes Market, By Type, 2017–2024 (Million Square Meters)
Table 37 Japan Geotextile Tubes Market, By End Use, 2017–2024 (USD Million)
Table 38 Japan Geotextile Tubes Market, By End Use, 2017–2024 (Million Square Meters)
Table 39 Japan Geotextile Tubes Market, By Type, 2017–2024 (USD Million)
Table 40 Japan Geotextile Tubes Market, By Type, 2017–2024 (Million Square Meters)
Table 41 South Korea Geotextile Tubes Market, By End Use, 2017–2024 (USD Million)
Table 42 South Korea Geotextile Tubes Market, By End Use, 2017–2024 (Million Square Meters)
Table 43 South Korea Geotextile Tubes Market, By Type, 2017–2024 (USD Million)
Table 44 South Korea Geotextile Tubes Market, By Type, 2017–2024 (Million Square Meters)
Table 45 Rest of Asia Pacific Geotextile Tubes Market, By End Use, 2017–2024 (USD Million)
Table 46 Rest of Asia Pacific Geotextile Tubes Market, By End Use, 2017–2024 (Million Square Meters)
Table 47 Rest of Asia Pacific Geotextile Tubes Market, By Type, 2017–2024 (USD Million)
Table 48 Rest of Asia Pacific Geotextile Tubes Market, By Type, 2017–2024 (Million Square Meters)
Table 49 North America Geotextile Tubes Market, By Country, 2017–2024 (USD Million)
Table 50 North America Geotextile Tubes Market, By Country, 2017–2024 (Million Square Meters)
Table 51 North America Geotextile Tubes Market, By End Use, 2017–2024 (USD Million)
Table 52 North America Geotextile Tubes Market, By End Use, 2017–2024 (Million Square Meters)
Table 53 North America Geotextile Tubes Market, By Type, 2017–2024 (USD Million)
Table 54 North America Geotextile Tubes Market, By Type, 2017–2024 (Million Square Meters)
Table 55 US Geotextile Tubes Market, By End Use, 2017–2024 (USD Million)
Table 56 US Geotextile Tubes Market, By End Use, 2017–2024 (Million Square Meters)
Table 57 US Geotextile Tubes Market, By Type, 2017–2024 (USD Million)
Table 58 US Geotextile Tubes Market, By Type, 2017–2024 (Million Square Meters)
Table 59 Canada Geotextile Tubes Market, By End Use, 2017–2024 (USD Million)
Table 60 Canada Geotextile Tubes Market, By End Use, 2017–2024 (Million Square Meters)
Table 61 Canada Geotextile Tubes Market, By Type, 2017–2024 (USD Million)
Table 62 Canada Geotextile Tubes Market, By Type, 2017–2024 (Million Square Meters)
Table 63 Mexico Geotextile Tubes Market, By End Use, 2017–2024 (USD Million)
Table 64 Mexico Geotextile Tubes Market, By End Use, 2017–2024 (Million Square Meters)
Table 65 Mexico Geotextile Tubes Market, By Type, 2017–2024 (USD Million)
Table 66 Mexico Geotextile Tubes Market, By Type, 2017–2024 (Million Square Meters)
Table 67 Europe Geotextile Tubes Market, By Country, 2017–2024 (USD Million)
Table 68 Europe Geotextile Tubes Market, By Country, 2017–2024 (Million Square Meters)
Table 69 Europe Geotextile Tubes Market, By End Use, 2017–2024 (USD Million)
Table 70 Europe Geotextile Tubes Market, By End Use, 2017–2024 (Million Square Meters)
Table 71 Europe Geotextile Tubes Market, By Type, 2017–2024 (USD Million)
Table 72 Europe Geotextile Tubes Market, By Type, 2017–2024 (Million Square Meters)
Table 73 Germany Geotextile Tubes Market, By End Use, 2017–2024 (USD Million)
Table 74 Germany Geotextile Tubes Market, By End Use, 2017–2024 (Million Square Meters)
Table 75 Germany Geotextile Tubes Market, By Type, 2017–2024 (USD Million)
Table 76 Germany Geotextile Tubes Market, By Type, 2017–2024 (Million Square Meters)
Table 77 France Geotextile Tubes Market, By End Use, 2017–2024 (USD Million)
Table 78 France Geotextile Tubes Market, By End Use, 2017–2024 (Million Square Meters)
Table 79 France Geotextile Tubes Market, By Type, 2017–2024 (USD Million)
Table 80 France Geotextile Tubes Market, By Type, 2017–2024 (Million Square Meters)
Table 81 Italy Geotextile Tubes Market, By End Use, 2017–2024 (USD Million)
Table 82 Italy Geotextile Tubes Market, By End Use, 2017–2024 (Million Square Meters)
Table 83 Italy Geotextile Tubes Market, By Type, 2017–2024 (USD Million)
Table 84 Italy Geotextile Tubes Market, By Type, 2017–2024 (Million Square Meters)
Table 85 UK Geotextile Tubes Market, By End Use, 2017–2024 (USD Million)
Table 86 UK Geotextile Tubes Market, By End Use, 2017–2024 (Million Square Meters)
Table 87 UK Geotextile Tubes Market, By Type, 2017–2024 (USD Million)
Table 88 UK Geotextile Tubes Market, By Type, 2017–2024 (Million Square Meters)
Table 89 Spain Geotextile Tubes Market, By End Use, 2017–2024 (USD Million)
Table 90 Spain Geotextile Tubes Market, By End Use, 2017–2024 (Million Square Meters)
Table 91 Spain Geotextile Tubes Market, By Type, 2017–2024 (USD Million)
Table 92 Spain Geotextile Tubes Market, By Type, 2017–2024 (Million Square Meters)
Table 93 Rest of Europe Geotextile Tubes Market, By End Use, 2017–2024 (USD Million)
Table 94 Rest of Europe Geotextile Tubes Market, By End Use, 2017–2024 (Million Square Meters)
Table 95 Rest of Europe Geotextile Tubes Market, By Type, 2017–2024 (USD Million)
Table 96 Rest of Europe Geotextile Tubes Market, By Type, 2017–2024 (Million Square Meters)
Table 97 Middle East & Africa Geotextile Tubes Market, By Country, 2017–2024 (USD Million)
Table 98 Middle East & Africa Geotextile Tubes Market, By Country, 2017–2024 (Million Square Meters)
Table 99 Middle East & Africa Geotextile Tubes Market, By End Use, 2017–2024 (USD Million)
Table 100 Middle East & Africa Geotextile Tubes Market, By End Use, 2017–2024 (Million Square Meters)
Table 101 Middle East & Africa Geotextile Tubes Market, By Type, 2017–2024 (USD Million)
Table 102 Middle East & Africa Geotextile Tubes Market, By Type, 2017–2024 (Million Square Meters)
Table 103 Saudi Arabia Geotextile Tubes Market, By End Use, 2017–2024 (USD Million)
Table 104 Saudi Arabia Geotextile Tubes Market, By End Use, 2017–2024 (Million Square Meters)
Table 105 Saudi Arabia Geotextile Tubes Market, By Type, 2017–2024 (USD Million)
Table 106 Saudi Arabia Geotextile Tubes Market, By Type, 2017–2024 (Million Square Meters)
Table 107 South Africa Geotextile Tubes Market, By End Use, 2017–2024 (USD Million)
Table 108 South Africa Geotextile Tubes Market, By End Use, 2017–2024 (Million Square Meters)
Table 109 South Africa Geotextile Tubes Market, By Type, 2017–2024 (USD Million)
Table 110 South Africa Geotextile Tubes Market, By Type, 2017–2024 (Million Square Meters)
Table 111 Rest of Middle East & Africa Geotextile Tubes Market, By End Use, 2017–2024 (USD Million)
Table 112 Rest of Middle East & Africa Geotextile Tubes Market, By End Use, 2017–2024 (Million Square Meters)
Table 113 Rest of Middle East & Africa Geotextile Tubes Market, By Type, 2017–2024 (USD Million)
Table 114 Rest of Middle East & Africa Geotextile Tubes Market, By Type, 2017–2024 (Million Square Meters)
Table 115 South America Geotextile Tubes Market, By Country, 2017–2024 (USD Million)
Table 116 South America Geotextile Tubes Market, By Country, 2017–2024 (Million Square Meters)
Table 117 South America Geotextile Tubes Market, By End Use, 2017–2024 (USD Million)
Table 118 South America Geotextile Tubes Market, By End Use, 2017–2024 (Million Square Meters)
Table 119 South America Geotextile Tubes Market, By Type, 2017–2024 (USD Million)
Table 120 South America Geotextile Tubes Market, By Type, 2017–2024 (Million Square Meters)
Table 121 Brazil Geotextile Tubes Market, By End Use, 2017–2024 (USD Million)
Table 122 Brazil Geotextile Tubes Market, By End Use, 2017–2024 (Million Square Meters)
Table 123 Brazil Geotextile Tubes Market, By Type, 2017–2024 (USD Million)
Table 124 Brazil Geotextile Tubes Market, By Type, 2017–2024 (Million Square Meters)
Table 125 Argentina Geotextile Tubes Market, By End Use, 2017–2024 (USD Million)
Table 126 Argentina Geotextile Tubes Market, By End Use, 2017–2024 (Million Square Meters)
Table 127 Argentina Geotextile Tubes Market, By Type, 2017–2024 (USD Million)
Table 128 Argentina Geotextile Tubes Market, By Type, 2017–2024 (Million Square Meters)
Table 129 Rest of South America Geotextile Tubes Market, By End Use, 2017–2024 (USD Million)
Table 130 Rest of South America Geotextile Tubes Market, By End Use, 2017–2024 (Million Square Meters)
Table 131 Rest of South America Geotextile Tubes Market, By Type, 2017–2024 (USD Million)
Table 132 Rest of South America Geotextile Tubes Market, By Type, 2017–2024 (Million Square Meters)
Table 133 Acquisitions, 2013–2019
Table 134 Expansions, 2013–2019
Table 135 New Product Launches, 2013–2019
Table 136 Supply Contracts, 2013–2019
Table 137 Collaborations, 2013–2019
Table 138 Distribution Agreements, 2013–2019
Table 139 Divestments, 2013–2019
List of Figures (37 Figures)
Figure 1 Geotextile Tubes Market Segmentation
Figure 2 Geotextile Tubes Market: Research Design
Figure 3 Bottom-Up Approach
Figure 4 Top-Down Approach
Figure 5 Geotextile Tubes Market: Data Triangulation
Figure 6 Marine & Hydraulic Segment Projected to Lead Geotextile Tubes Market During the Forecast Period
Figure 7 Woven Segment Projected to Lead Geotextile Tubes Market Between 2019 and 2024
Figure 8 Geotextile Tubes Market in Asia Pacific Expected to Grow at the Highest CAGR Between 2019 and 2024
Figure 9 Rising Ocean Levels and Protection of Coastlines are Among the Major Factors Driving the Geotextile Tubes Market
Figure 10 Woven Segment Estimated to Grow at A Higher CAGR During the Forecast Period as Compared to Nonwoven Segment
Figure 11 Marine & Hydraulic Segment Expected to Lead the Geotextile Tubes Market During the Forecast Period
Figure 12 Geotextile Tubes Market in Asia Pacific Projected to Grow at the Highest CAGR Between 2019 and 2024
Figure 13 Geotextile Tubes Market Dynamics
Figure 14 Porter’s Five Forces Analysis
Figure 15 Global Average Crude Oil Prices Between December 2015 and March 2019
Figure 16 Projected Global Average Price of Polypropylene Between January 2014 and March 2020
Figure 17 Global Investment Projections for Infrastructure Developments, By Region, 2016–2040 (USD Trillion)
Figure 18 Geotextile Tubes Market, By Type, 2019–2024 (USD Million)
Figure 19 Woven Geotextile Tubes Market, By Region, 2019–2024 (USD Million)
Figure 20 Nonwoven Geotextile Tubes Market, By Region, 2019–2024 (USD Million)
Figure 21 Geotextile Tubes Market, By End Use, 2019 & 2024 (USD Million)
Figure 22 Geotextile Tubes Market for Marine & Hydraulic, By Region, 2019 & 2024 (USD Million)
Figure 23 Geotextile Tubes Market for Environmental Engineering, By Region, 2019 & 2024 (USD Million)
Figure 24 Geotextile Tubes Market for Agricultural Engineering, By Region, 2019 & 2024 (USD Million)
Figure 25 Geotextile Tubes Market for Construction, By Region, 2019 & 2024 (USD Million)
Figure 26 China and India are Projected to Be Potential Markets for Geotextile Tubes From 2019 to 2024
Figure 27 Asia Pacific Geotextile Tubes Market Snapshot
Figure 28 North America Geotextile Tubes Market Snapshot
Figure 29 Europe Geotextile Tubes Market Snapshot
Figure 30 Middle East & Africa Geotextile Tubes Market Snapshot
Figure 31 South America Geotextile Tubes Market Snapshot
Figure 32 Companies Adopted Both Organic and Inorganic Growth Strategies Between May 2013 and August 2019
Figure 33 Geotextile Tubes Market: (Global) Competitive Leadership Mapping, 2019
Figure 34 Koninklijke Tencate: Company Snapshot
Figure 35 Fibertex Nonwovens: Company Snapshot
Figure 36 Low & Bonar (Enka Solutions): Company Snapshot
Figure 37 Flexituff Ventures International Ltd.: Company Snapshot
This research study involved four major activities in estimating the current market size for geotextile tubes. Exhaustive secondary research was undertaken to collect information on the market, the peer market, and the parent market. The next step was to validate these findings, assumptions, and sizing with industry experts across the value chain through primary research. Both top-down and bottom-up approaches were employed to estimate the complete market size. After that, market breakdown and data triangulation procedures were used to estimate the market size of segments and subsegments.
Secondary Research
In the secondary research process, various secondary sources, such as Hoovers, Bloomberg BusinessWeek, and Dun & Bradstreet were referred to identify and collect information for this study. These secondary sources included annual reports, press releases & investor presentations of companies, white papers, certified publications, articles by recognized authors, gold standard & silver standard websites, regulatory bodies, trade directories, and databases.
Primary Research
The geotextile tubes market comprises several stakeholders, such as raw material suppliers, processors, end-product manufacturers, and regulatory organizations in the supply chain. The demand side of this market is characterized by the growth of the marine & hydraulic, environmental engineering, agricultural engineering, and construction segments. The supply side is characterized by advancements in technology and diverse application industries. Various primary sources from both the supply and demand sides of the market were interviewed to obtain qualitative and quantitative information. Following is the breakdown of primary respondents interviewed:
To know about the assumptions considered for the study, download the pdf brochure
Market Estimation
Both top-down and bottom-up approaches were used to estimate and validate the total size of the geotextile tubes market. These methods were also used extensively to estimate the size of the various subsegments in the market. The research methodology used to estimate the market size includes the following:
- Key players in the industry were identified through extensive secondary research.
- The industry’s supply chain and market size, in terms of volume and value, were determined through primary and secondary research.
- All percentage shares, splits, and breakdowns were determined using secondary sources and verified through primary sources.
Data Triangulation
After arriving at the overall market size-using the market size estimation processes explained above-the market was split into several segments and subsegments. To complete the overall market engineering process and arrive at the exact statistics of each market segment and subsegment, data triangulation, and market breakdown procedures were employed, wherever applicable. The data was triangulated by studying various factors and trends from both the demand and supply sides, in the marine & hydraulic, environmental engineering, agricultural engineering, and construction segments.
Report Objectives
- To define, describe, and forecast the global geotextile tubes market based on type, end-use, and region in terms of volume and value
- To provide detailed information about key factors, such as drivers, restraints, opportunities, and challenges influencing the growth of the market
- To strategically analyze micromarkets1 with respect to individual growth trends, prospects, and contribution to the total market
- To analyze the opportunities in the market for stakeholders and draw a competitive landscape
- To forecast the market size in terms of volume and value with respect to five main regions, namely, Asia Pacific, North America, Europe, the Middle East & Africa, and South America, along with their key countries
- To analyze competitive developments, such as expansions, acquisitions, supply contracts, collaboration, distribution agreement, divestment, and new product launches, activities in the geotextile tubes market
- To strategically profile the key players operating in the geotextile tubes market and comprehensively analyze their core competencies2
The following customization options are available for the report
With the given market data, MarketsandMarkets offers customizations as per the specific needs of companies. The following customization options are available for the report:
- Further breakdown of the Rest of Asia Pacific, the Rest of Europe, and the Rest of Middle East & Africa by type in terms of volume and value
- Further breakdown of the Rest of Asia Pacific, the Rest of Europe, and the Rest of Middle East & Africa by end-use in terms of volume and value
- Further breakdown of the Rest of Asia Pacific, the Rest of Europe, and the Rest of Middle East & Africa in terms of volume and value
- Detailed analysis and profiles of additional market players (up to 5)


Growth opportunities and latent adjacency in Geotextile Tubes Market